Project set up
Overview
Teaching: 5 min
Exercises: 10 minQuestions
How to have your project set up?
Objectives
We need to collect information from your traits to generate a data collection spreadsheet for your project.
Before you start collecting phenotypic data in your trial, please get in touch with us via  to setup your project in KnowPulse. One of us will help you to set up all the details and register you under your project. Meanwhile, we need to collect detailed information about your project, including Project Name and Project Description. After that, you will be able to access the following information:
- Information in text and photo format on how data should be collected for each trait.
- A page to download data collection spreadsheet file pre-filled with project specific traits and formatted in a way expected by KnowPulse/module (This file is used to record data).
- A space in KnowPulse that you can backup spreadsheet file and access backed up files anywhere.
More information
All the data collecting, uploading, and downloading instructions from previous episodes can also be found in a video demonstration format (requires log in to access).
If you need further clarification on any issue or encounter any technical difficulties, please get in touch with us.
Key Points
Log in KnowPulse with your user account to find out about your project.
Please provide a detailed description of your traits.
The data collection spreadsheet
Overview
Teaching: 10 min
Exercises: 20 minQuestions
How to fill your data in the template?
Objectives
Providing a step by step demonstration on where to download and how to fill in a data collection spreadsheet.
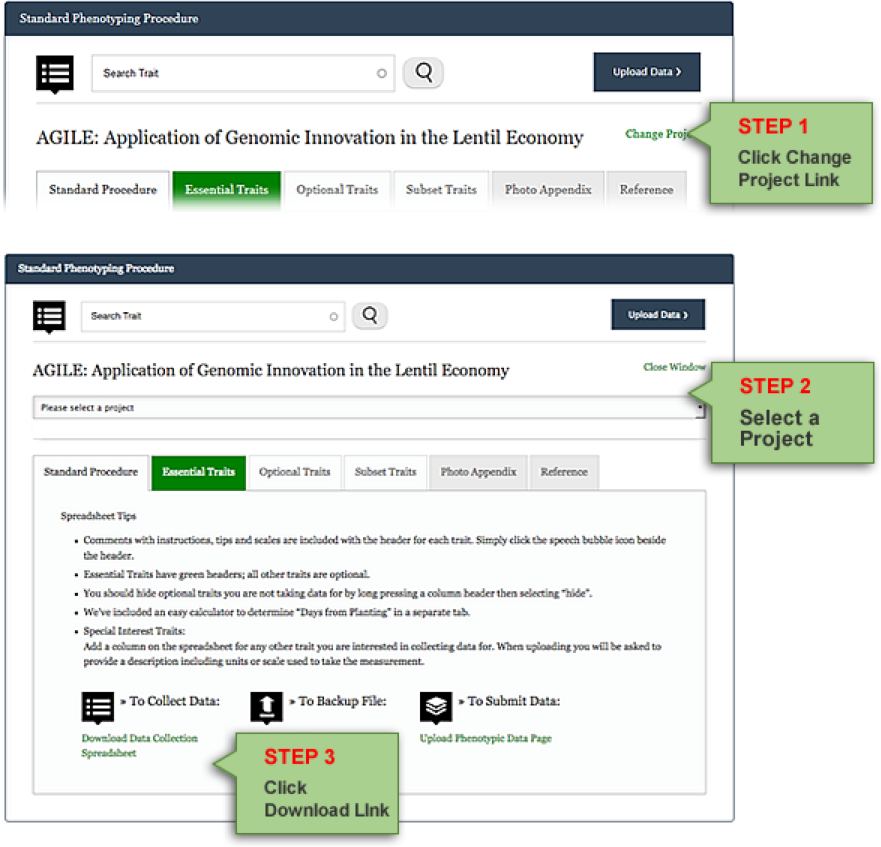
How to download data collection spreadsheet file
Data collection spreadsheet can be downloaded from Standard Phenotyping Procedure (requires log in to access).
- Click Change Project link, located next the project title of the currently active project to show Change Project Form.
- Select a project when prompted. The instructions page will reload with a new active project. This will ensure that you are downloading the data collection spreadsheet file corresponding to a project that you are working on.
- Click the Download Data Collection Spreadsheet link in the Standard Procedure Tab to begin file download. Click save when prompted.
You will get a data collection spreadsheet as shown in the screenshot.
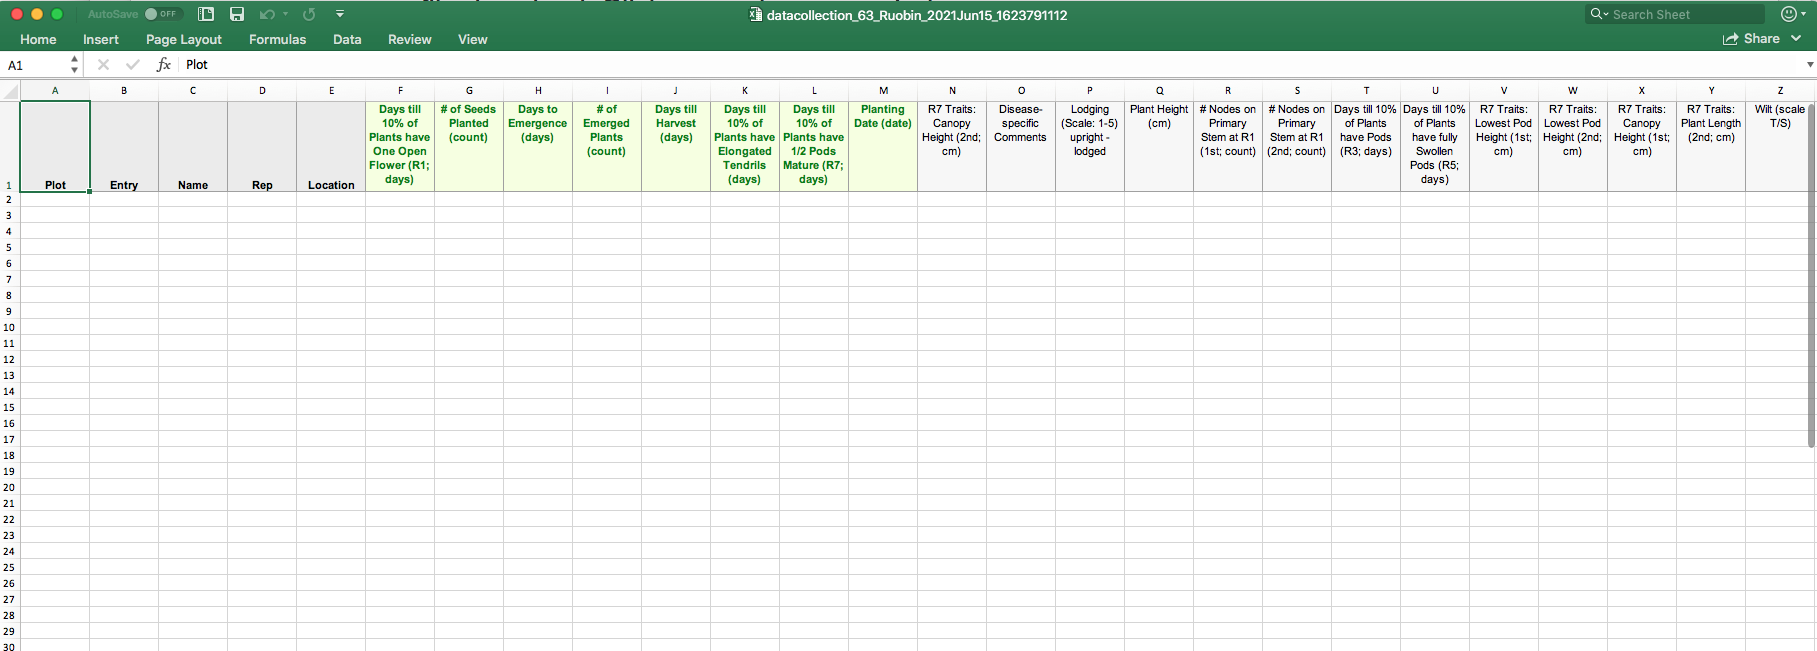 Columns A to E are default headers, followed by one column per trait. If any of these default traits do not apply to your data, fill the column with n/a. In the name column, all your names must match the existing germplasm names in KnowPulse. There is another tutorial to guide you through the Germplasm Search process. If your germplasm does not exist in KnowPulse yet, please contact us.
Please note, each project can only handle one data collection spreadsheet, therefore, if you think you will need to upload multiple files, please contact us.
Key Points
Make sure all the names under the name column match existing germplasm in KnowPulse.
Upload only one file under each project.
Backup and upload your data
Overview
Teaching: 10 min
Exercises: 20 minQuestions
How to store and manage your data?
Objectives
Providing a step by step demonstration on how to backup multiple versions of your data collection spreadsheet file into the server before submitting them to the module through the upload data page.
Data backup
Data backup function (requires login to access) allows you to backup multiple versions of your raw phenotypic data files into the KnowPulse during the growing season.
Please note, your data file needs to be saved as Excel Workbooks (.xlsx).
How to back up your data
- Select the project that corresponds to data collection spreadsheet file.
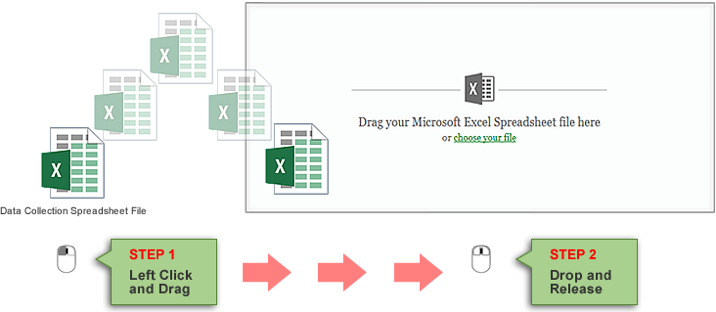
- Then drag and drop your file to the File Drop Zone Area or click choose file to launch file browser window (See figure below).
- A text box for describing data collection in its current state is provided to make it easier to reference back to if needed.
You can view all your files in Manage My Files section.
Click here (requires log in to access) to see a detailed video instruction to learn the data backup procedure.
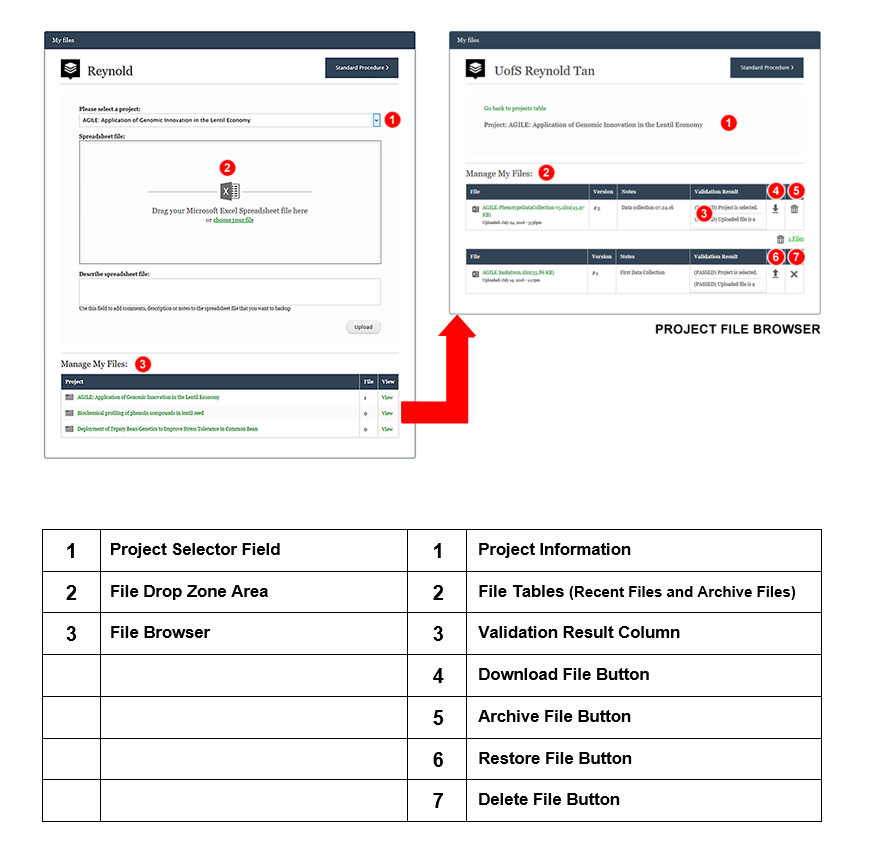
How to archive, restore and delete a file
- In File Browser, click the Trash Bin icon to archive a file.
 will indicate that there are archive files in a project.
 - Click Archive file indicator to disclose archive files table.
- In archive files table, options to restore file and physically delete file will become available. You will be prompted to confirm any action to a file.
Key Points
We encourage you to backup/upload raw phenotypic data regularly. The data is expected to be raw, so do not worry about cleaning it up between backups or for upload.
Save your file as .xlsx format before upload.
Upload your data collection file
Overview
Teaching: 10 min
Exercises: 20 minQuestions
How to upload your data?
Objectives
Providing a step by step demonstration on how to upload data through three-steps data uploading process.
After your data collection spreadsheet file is properly filled, it is time to upload it.
How to upload data file
- Select the project that corresponds to data collection spreadsheet file.
- Drag and Drop file to the File Drop Zone Area or click choose file to launch file browser window as shown in the screenshot.
- The upload process will initiate once a valid file is detected in the File Drop Zone Area. At this stage, you will be notified whether the file has passed or failed basic compliance test.
The upload process has three stages
Stage 1. Validate Spreadsheet
This stage is designed to ensure your data file meets all the requirements from the importer. Validation errors may be detected in the file as shown and you want to fix them according to the validation result.
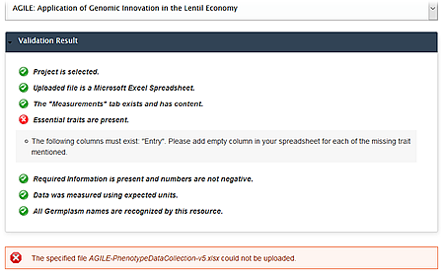
Click here to view more troubleshooting instructions, or please contact us if you need help.
Stage 2. Describe New Trait
At this stage, your spreadsheet is examined for additional phenotypes. New trait(s) will be detected in your spreadsheet at this stage, and you are requested to add description(s) for new trait(s). If there are no additional traits found, you may proceed to the next stage where spreadsheet file and data are stored.
Stage 3. Save Spreadsheet
You will get feedback once your file has been uploaded successfully, click on bottom right Next Step to store your file.
It is important to note that it is only when the progress bar reaches 100% and the status becomes Completed! that data will become available in Raw Phenotypic Data Page and Download Data Page.
Key Points
Save your file as XLSX format before upload.
Please make sure you upload your data file to the right project.
Only new traits require trait descriptions at this stage.
Download your data
Overview
Teaching: 10 min
Exercises: 10 minQuestions
How to download your data from KnowPulse?
Objectives
Providing a step by step demonstration on how to download subset/full set of data from KnowPulse.
How to download phenotypic data
- Select a project from Project Selector Field. To download all data from all available project, select All Projects.
- Select location from Location Selector Field. To select all locations, click the select all locations checkbox.
- Select Traits from Trait Selector Field. To select all traits, click the select all trait checkbox.
- Check other download option and click Download button to begin file download.
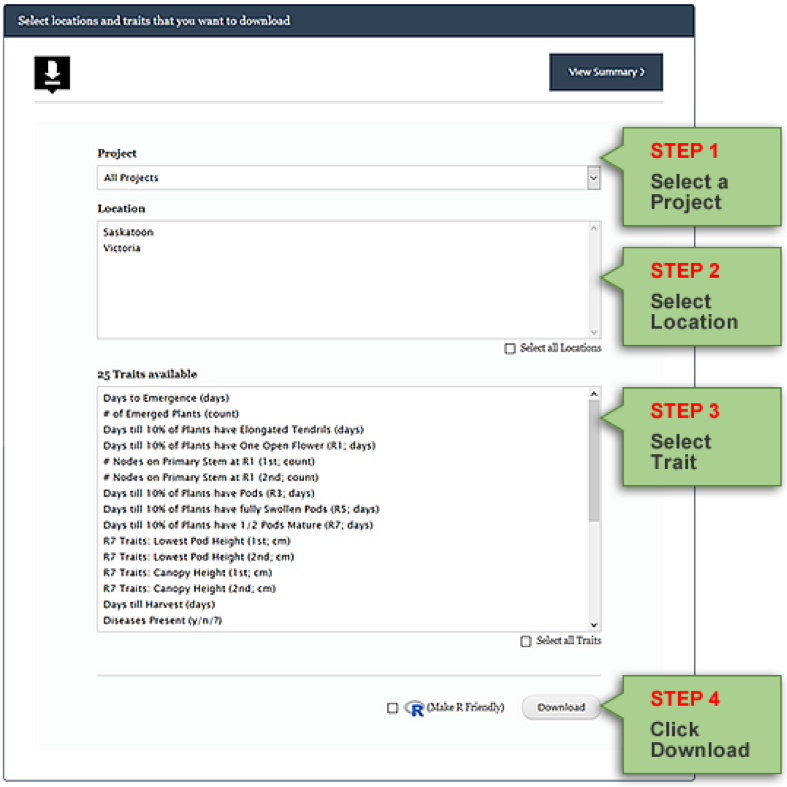
Data generated from this page is in comma separated or CSV format and is R and Microsoft Excel compatible.
Download progress
- Click File link in File summary window when file download process is complete.
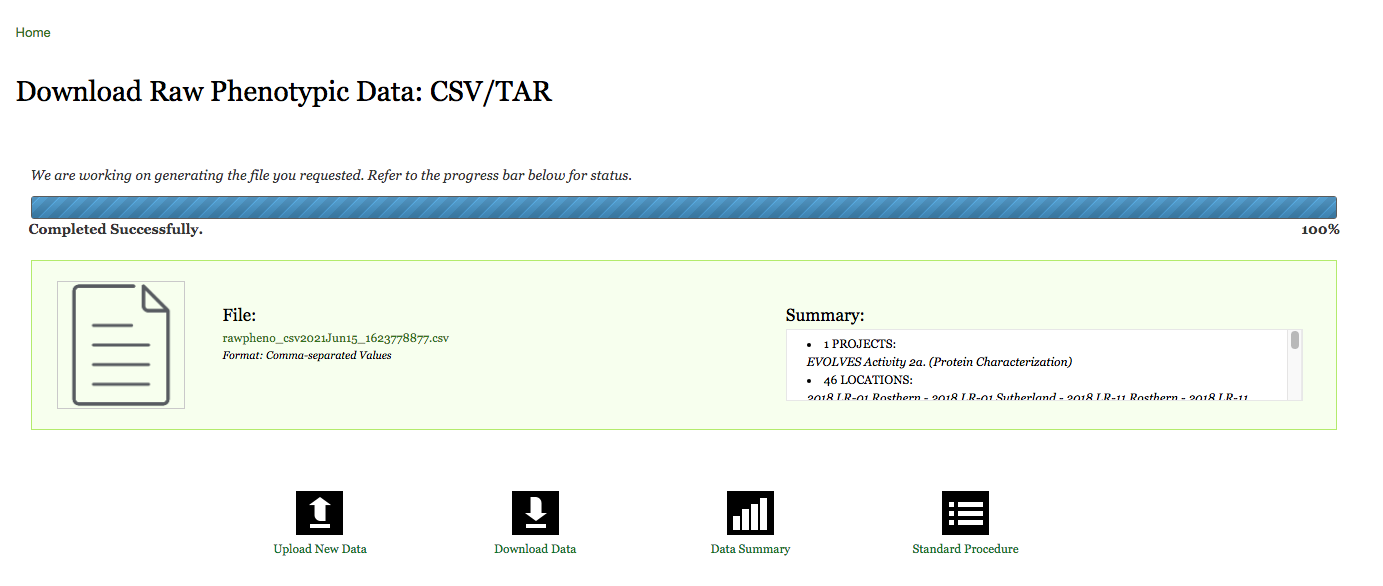
- Click Ok when prompted to save file.
Key Points
Log in KnowPulse with your user account before viewing and to download your data.
View your data
Overview
Teaching: 10 min
Exercises: 10 minQuestions
How to view your data from KnowPulse?
Objectives
Providing a step by step demonstration on how to view your interest trait(s) from KnowPulse.
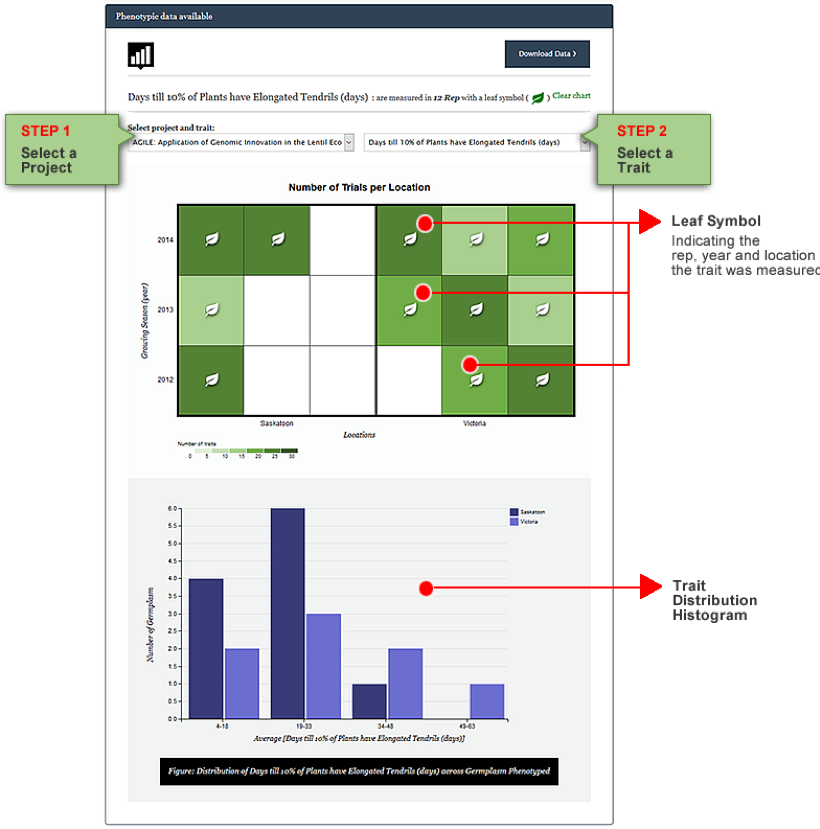
How to highlight a trait of interest and create trait distribution histogram
Your data will be summarized in an interactive diagram that shows the growing year(s) and location(s) as shown in the example below Raw Phenotypic Data (requires login to access).
- Select a project from Project Selector Field to load project-specific column headers/traits.
- Select a trait of interest in the Trait Selector Field.
- The square blocks will be marked by a Leaf Symbol on indicate that the trait was measured in that particular rep, year and location. Below this chart, Trait Distribution histogram is generated.
Key Points
Log in KnowPulse with your user account before viewing your data.