View your data
Overview
Teaching: 10 min
Exercises: 10 minQuestions
How to view your data from KnowPulse?
Objectives
Providing a step by step demonstration on how to view your interest trait(s) from KnowPulse.
How to highlight a trait of interest and create trait distribution histogram
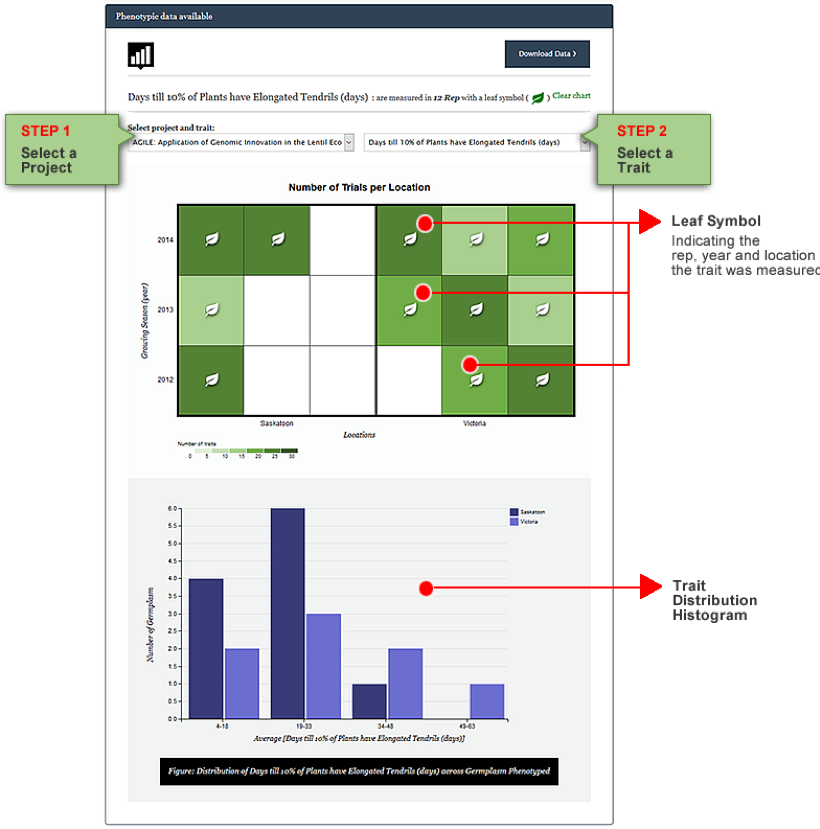
Your data will be summarized in an interactive diagram that shows the growing year(s) and location(s) as shown in the example below Raw Phenotypic Data (requires login to access).
- Select a project from Project Selector Field to load project-specific column headers/traits.
- Select a trait of interest in the Trait Selector Field.
- The square blocks will be marked by a Leaf Symbol on indicate that the trait was measured in that particular rep, year and location. Below this chart, Trait Distribution histogram is generated.

Key Points
Log in KnowPulse with your user account before viewing your data.