Visualize data in R: ggplot2 package and more
Overview
Teaching: 20 min
Exercises: 30 minQuestions
How to plot data with ggplot2?
Objectives
Visuallize your data with ggplot2.
ggplot2 package
Compare to basic plots, ggplot2 package provides better visually appealing plots. ggplot2 package needs to be installed before use.
Install
click on Packages tab, select on Install, then search ggplo2 under Packages to install ggplots2.
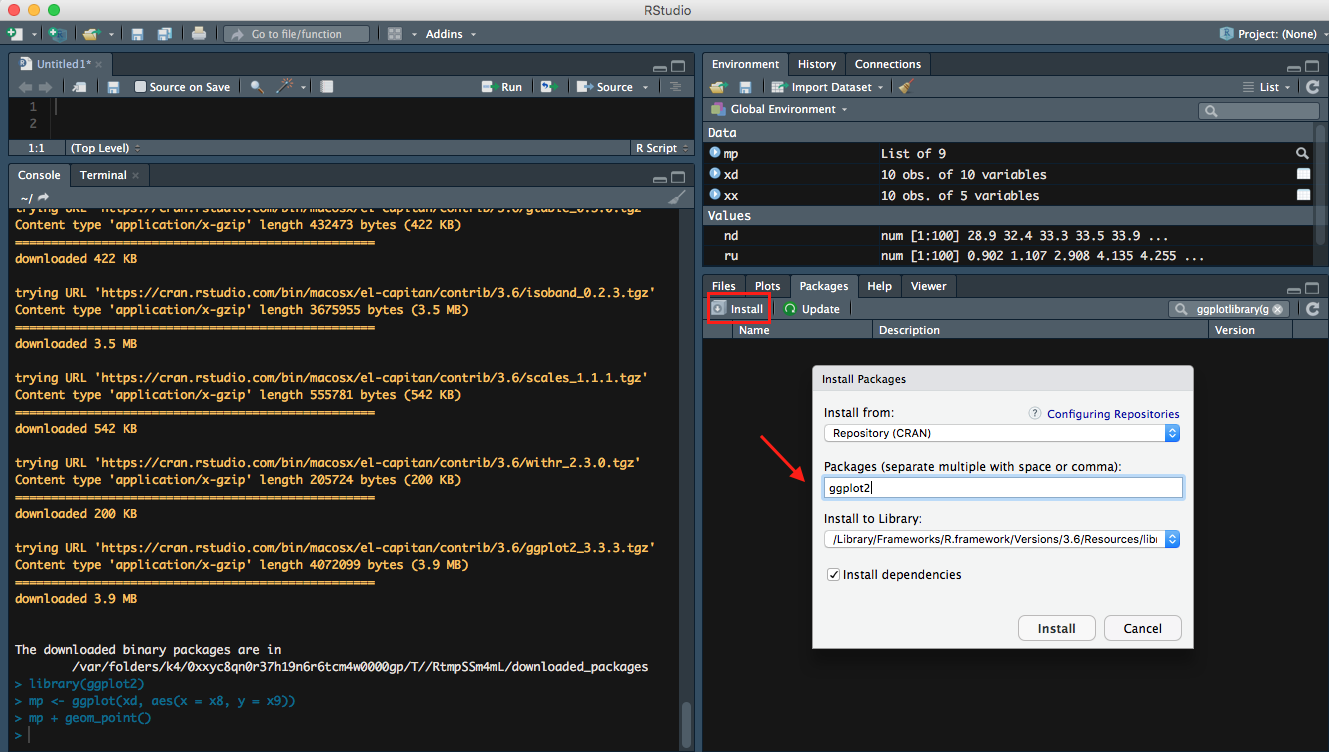
- ggplot2 is one of the core packeages from
Tidyverse, so you may already downloaded it from previous lesson.
Useful Resources
- Data Visualization with ggplot2 Cheat Sheet
- ggplot2 part of the tidyverse
- ggplot2
- How to make any plot in ggplot2?
- Graphics in R with ggplot2
Points
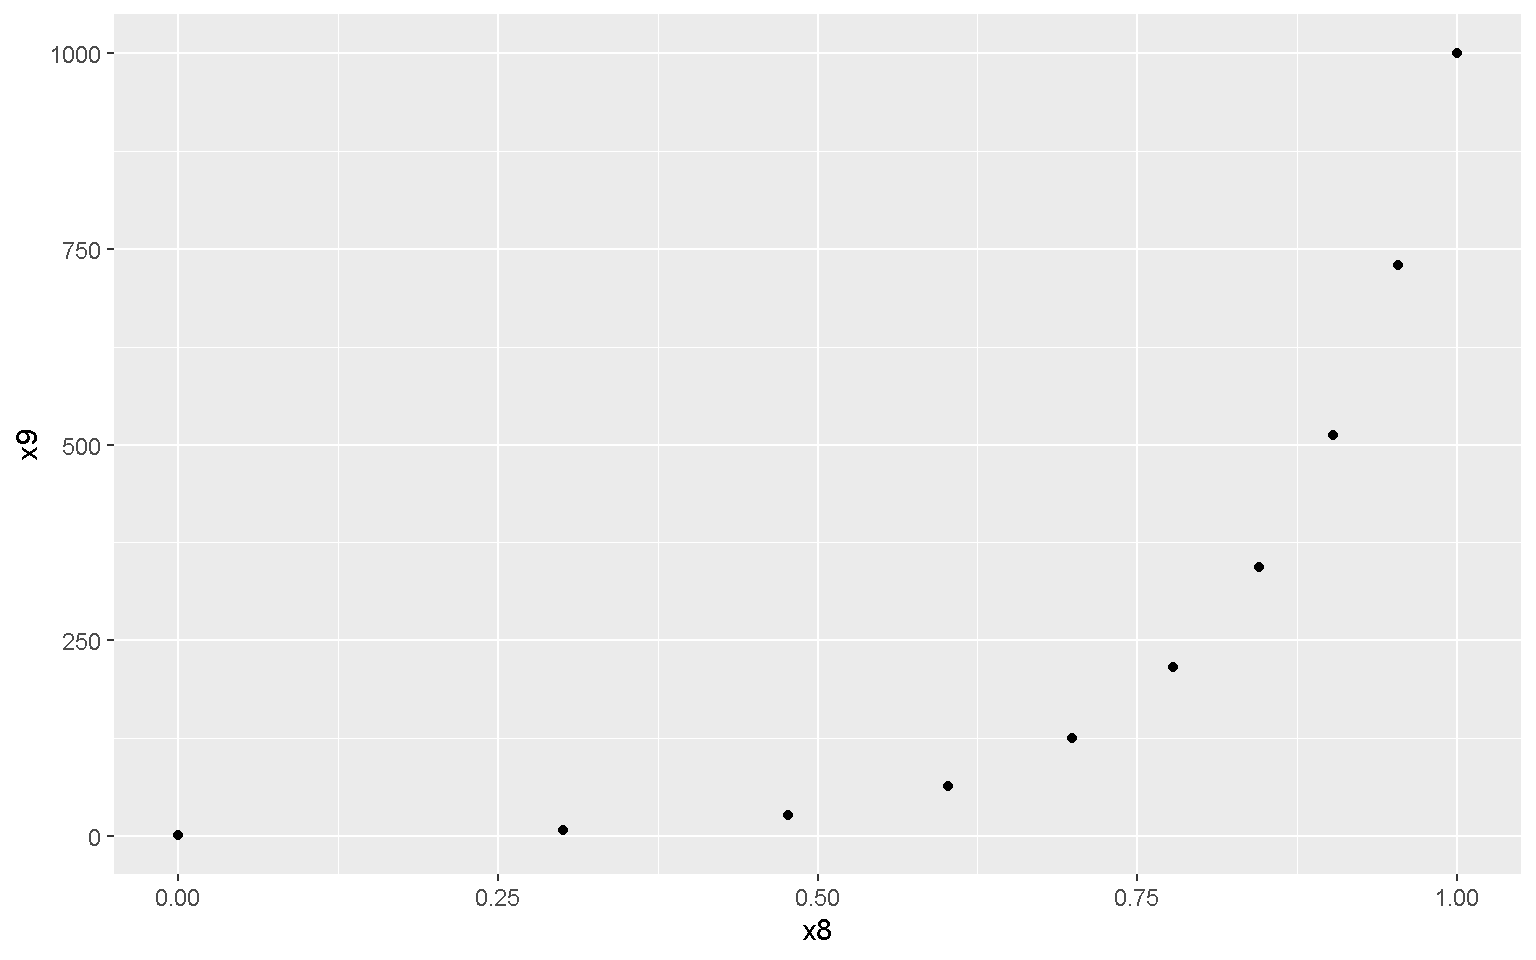
library(ggplot2)
mp <- ggplot(xd, aes(x = x8, y = x9))
mp + geom_point()
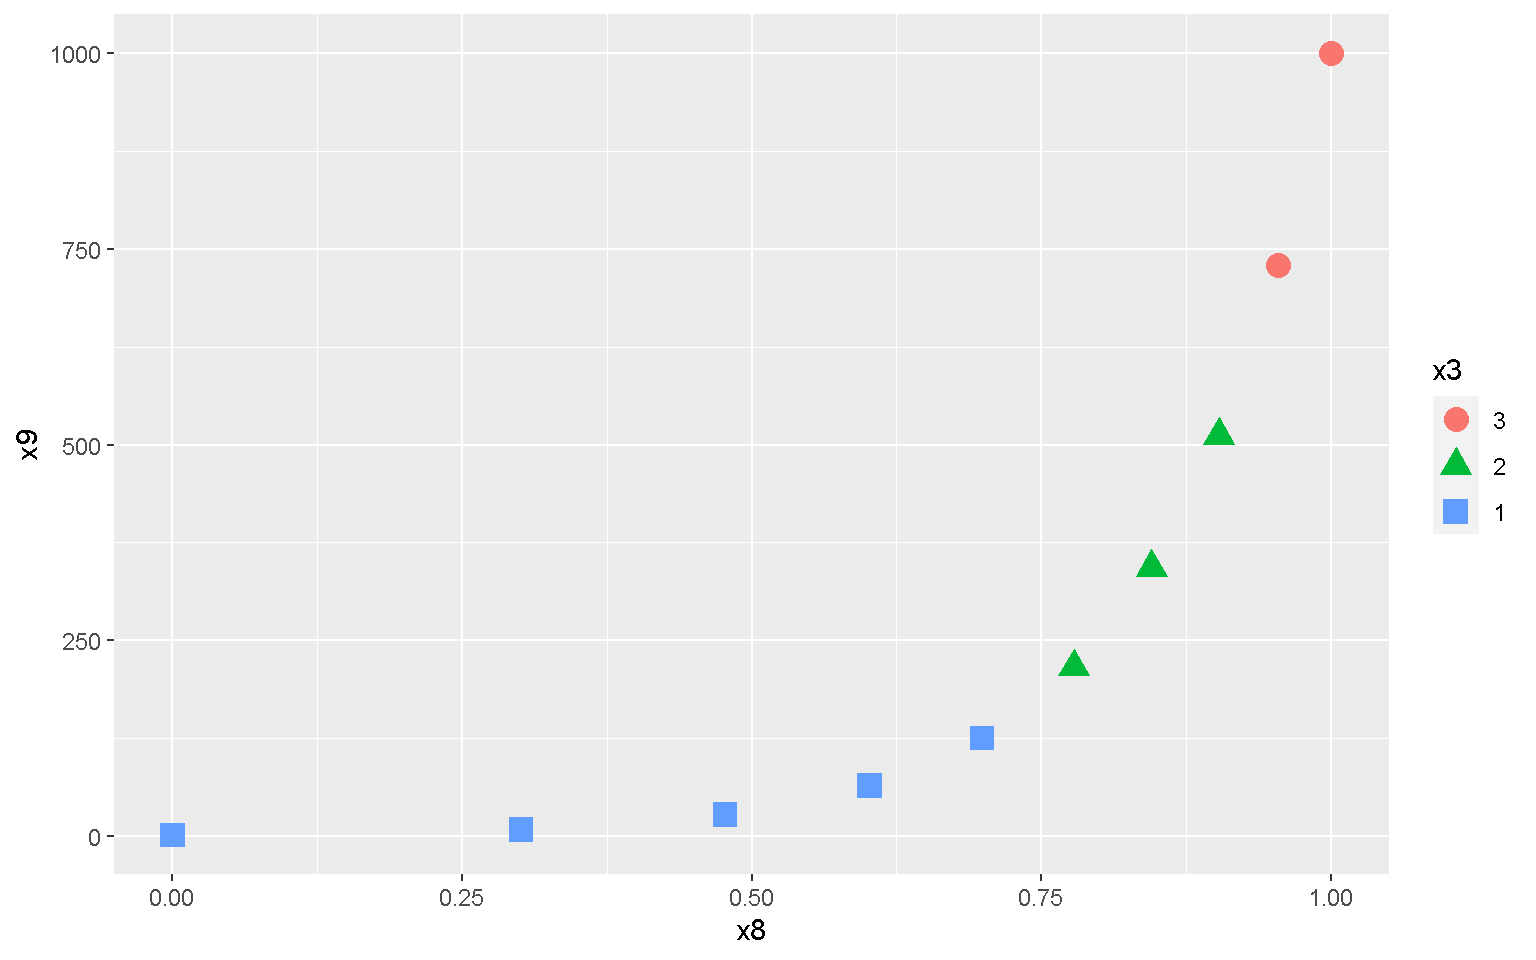
mp + geom_point(aes(color = x3, shape = x3), size = 4)
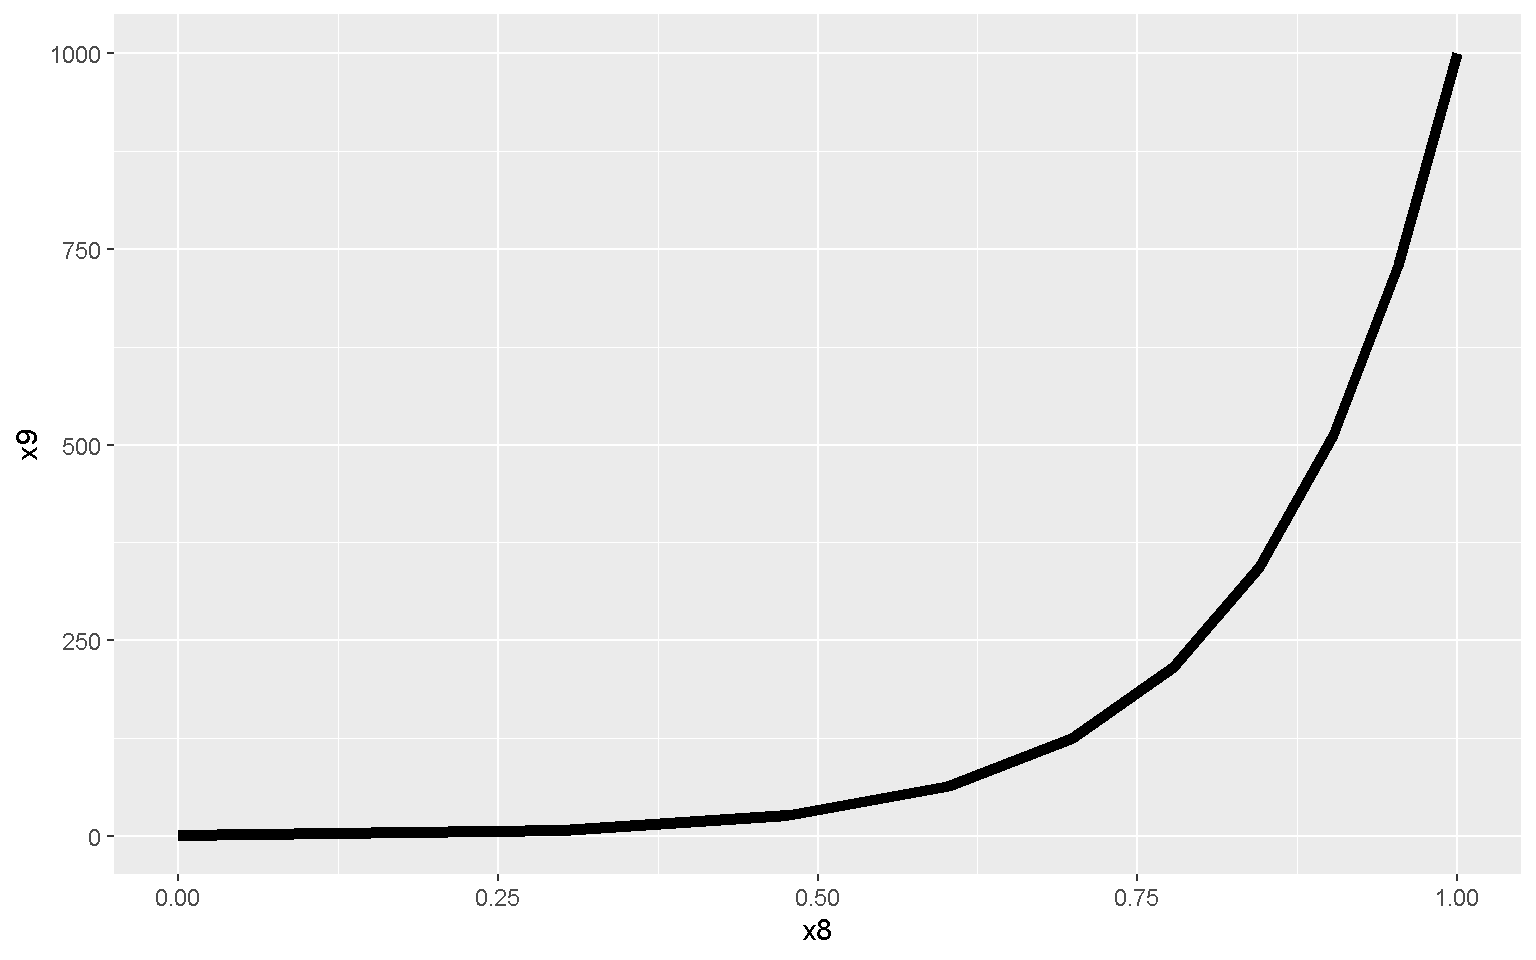
Lines
mp + geom_line(size = 2)
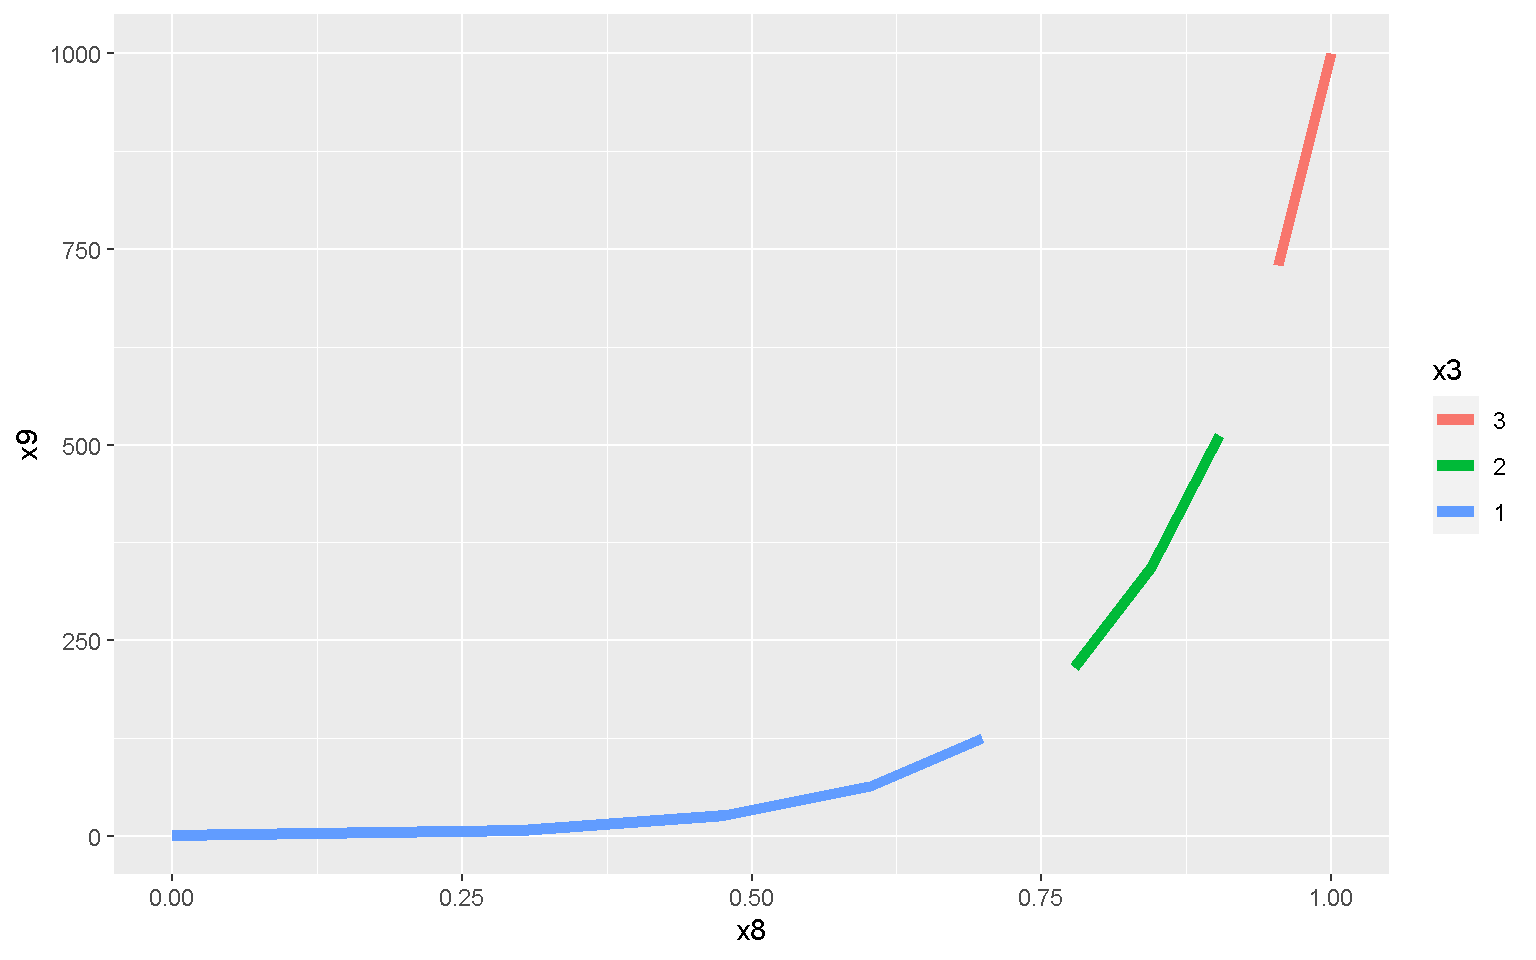
mp + geom_line(aes(color = x3), size = 2)
Smoothed Conditional Means
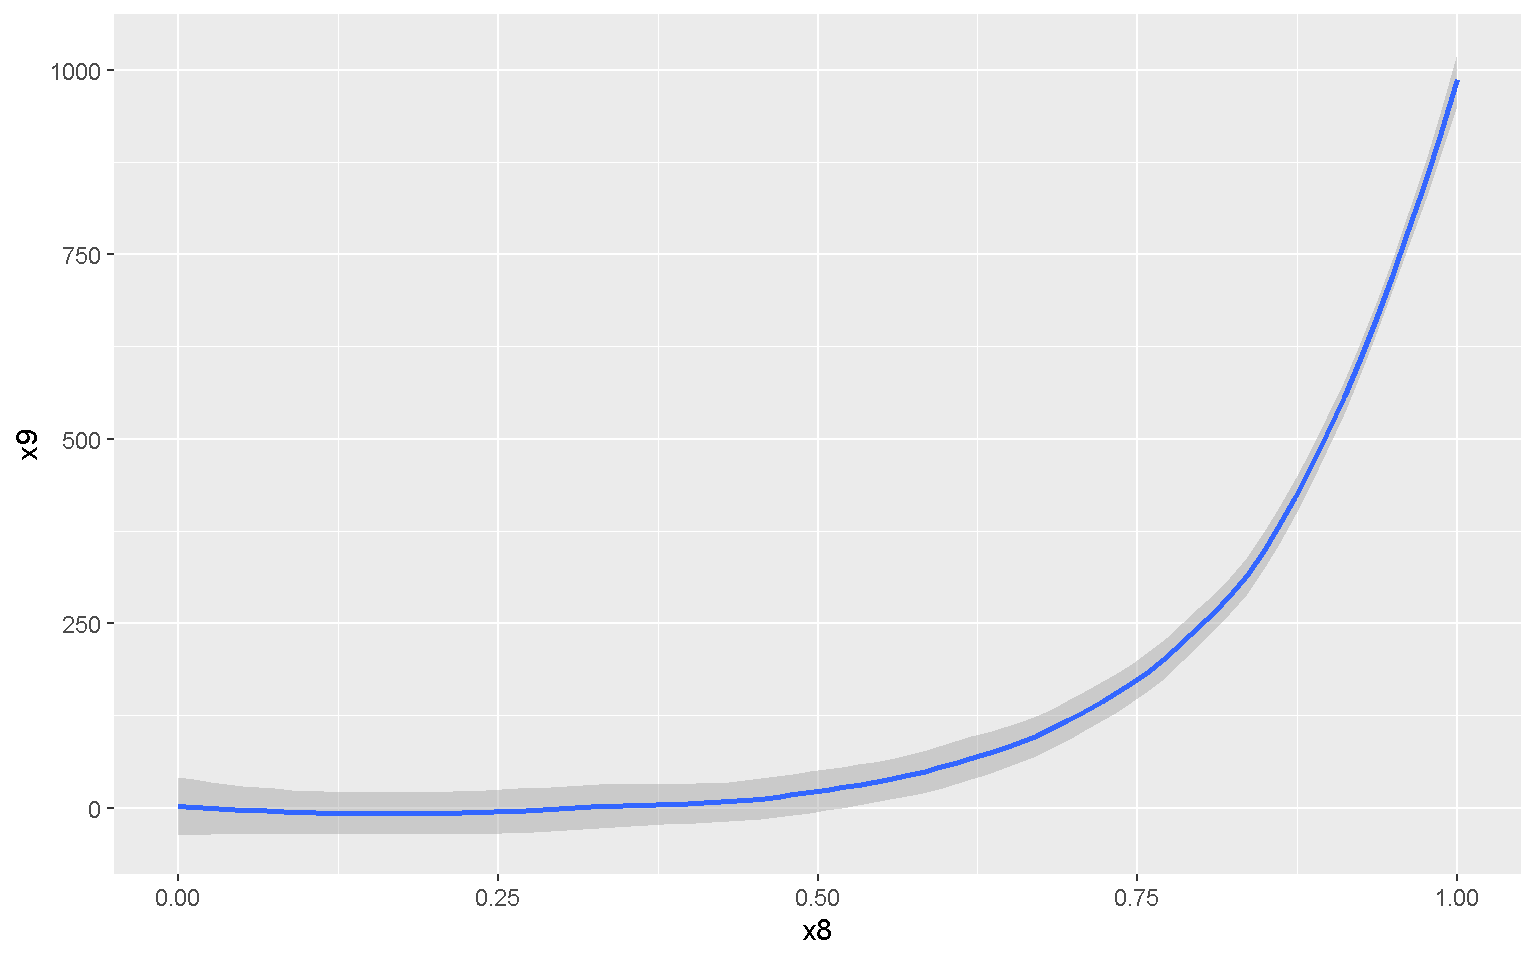
mp + geom_smooth(method = "loess")
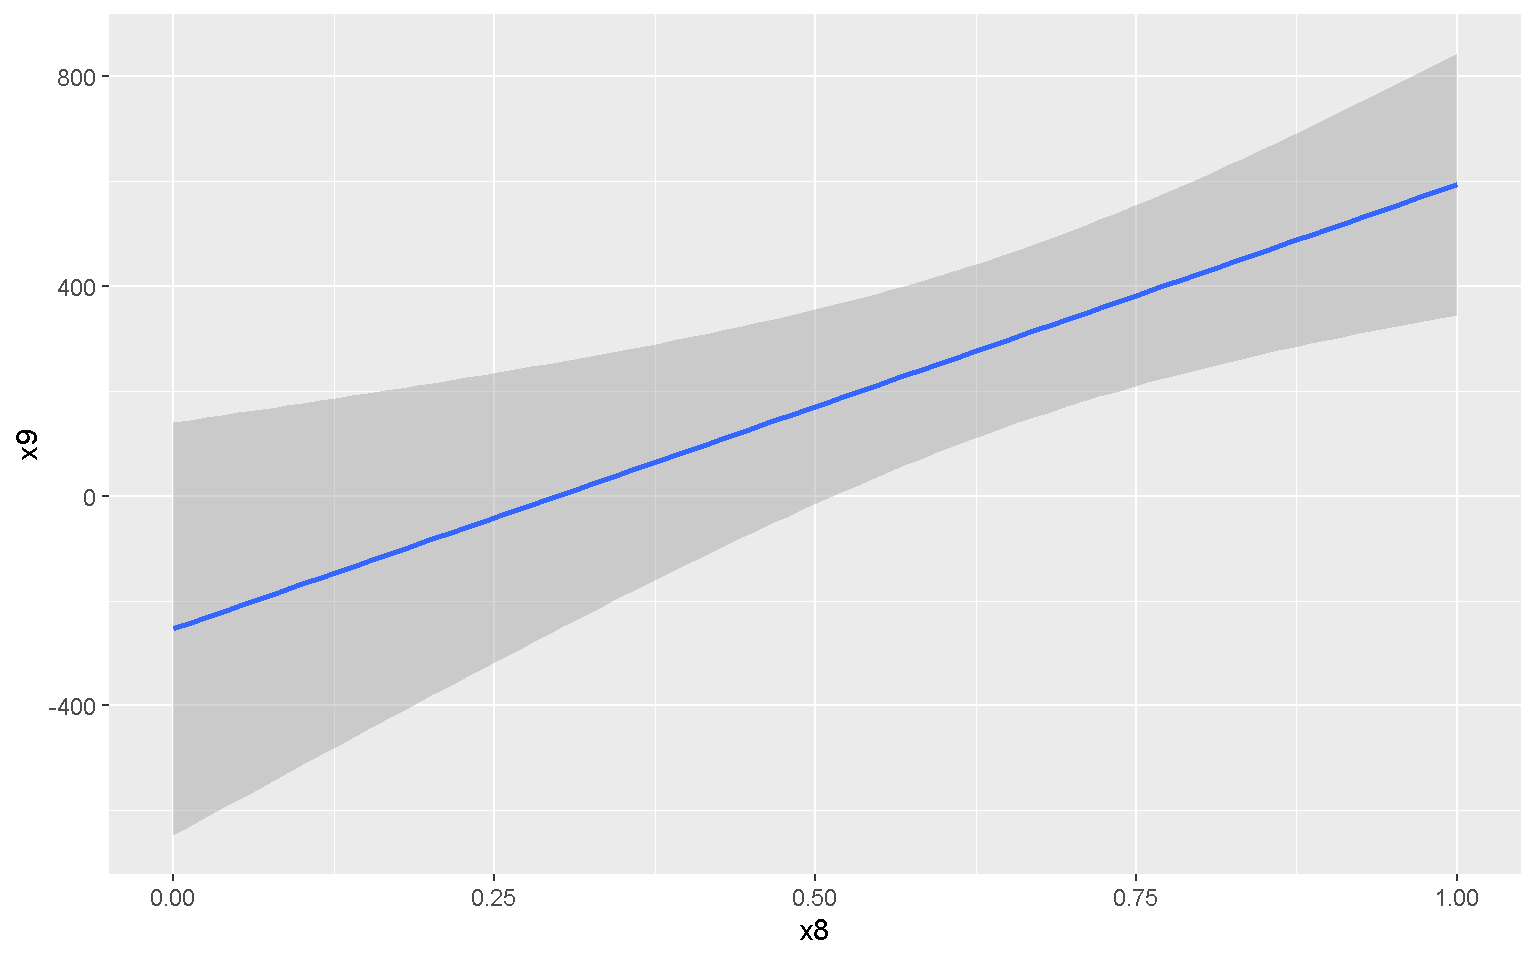
mp + geom_smooth(method = "lm")
Histogram
xx <- data.frame(data = c(rnorm(50, mean = 40, sd = 10),
rnorm(50, mean = 60, sd = 5)),
group = factor(rep(1:2, each = 50)),
label = c("Label1", rep(NA, 49), "Label2", rep(NA, 49)))
mp <- ggplot(xx, aes(x = data, fill = group))
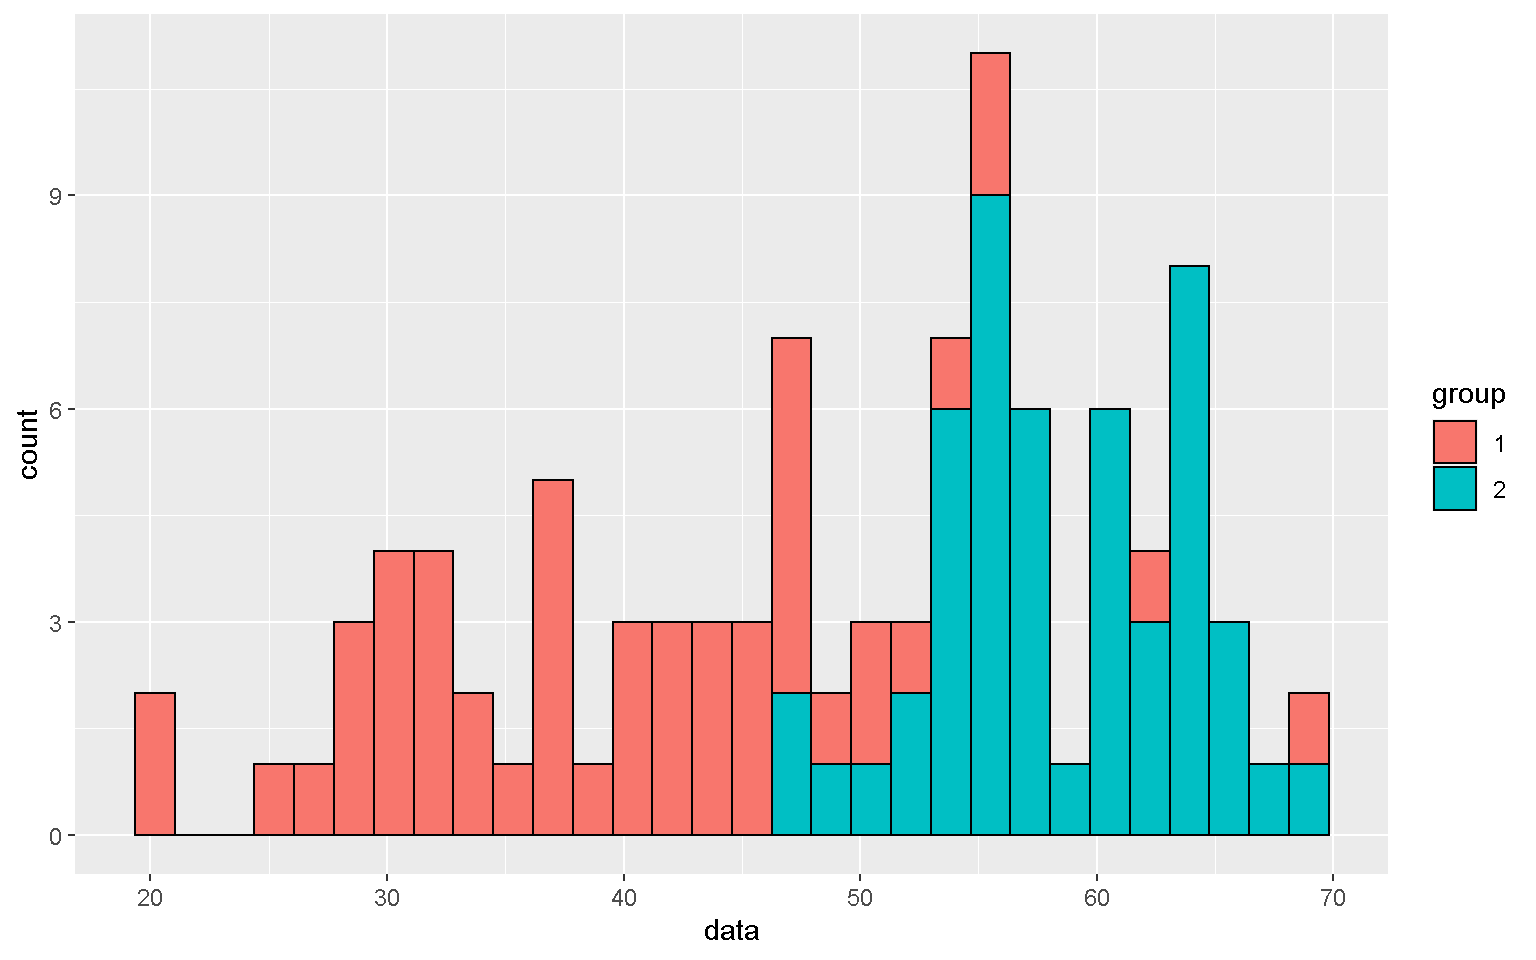
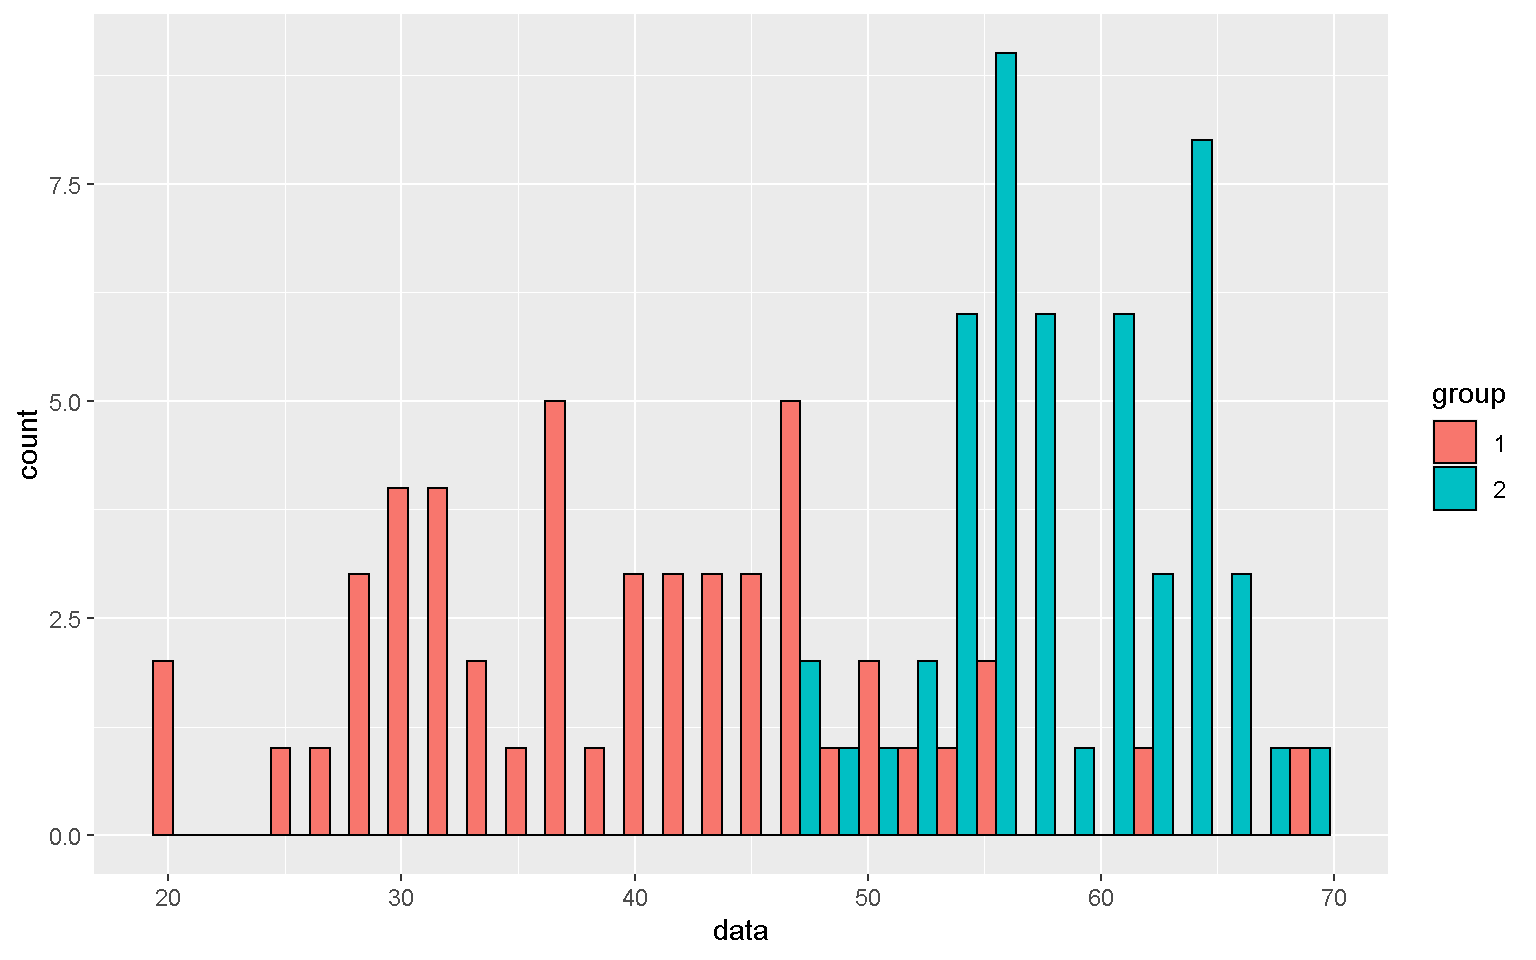
mp + geom_histogram(color = "black")
mp + geom_histogram(color = "black", position = "dodge")
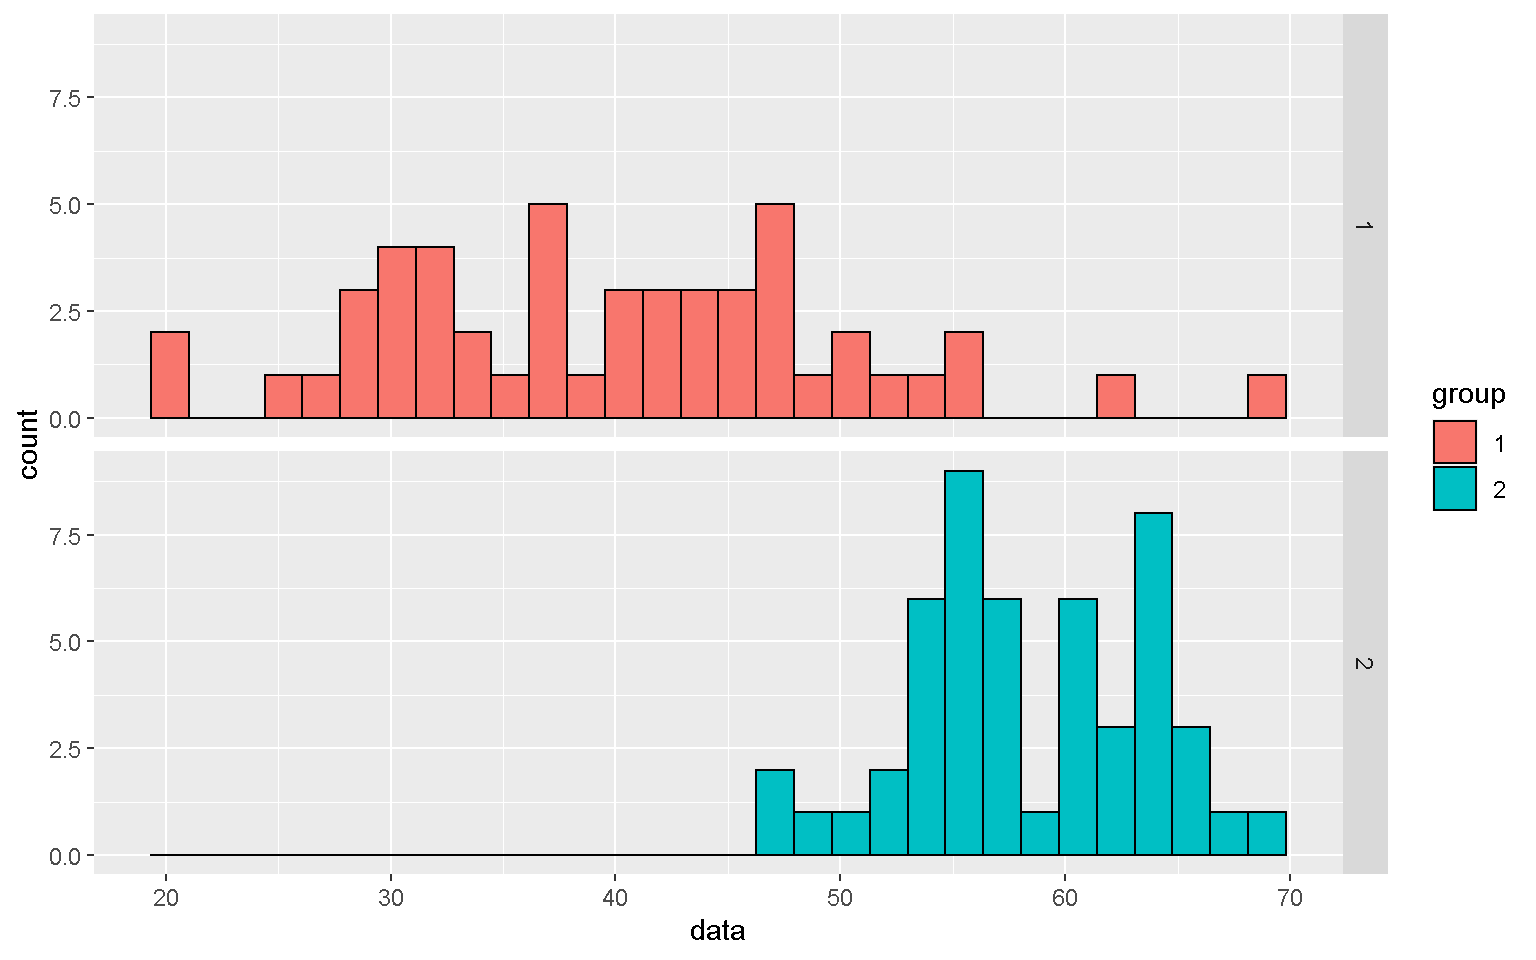
mp1 <- mp + geom_histogram(color = "black") + facet_grid(group~.)
mp1
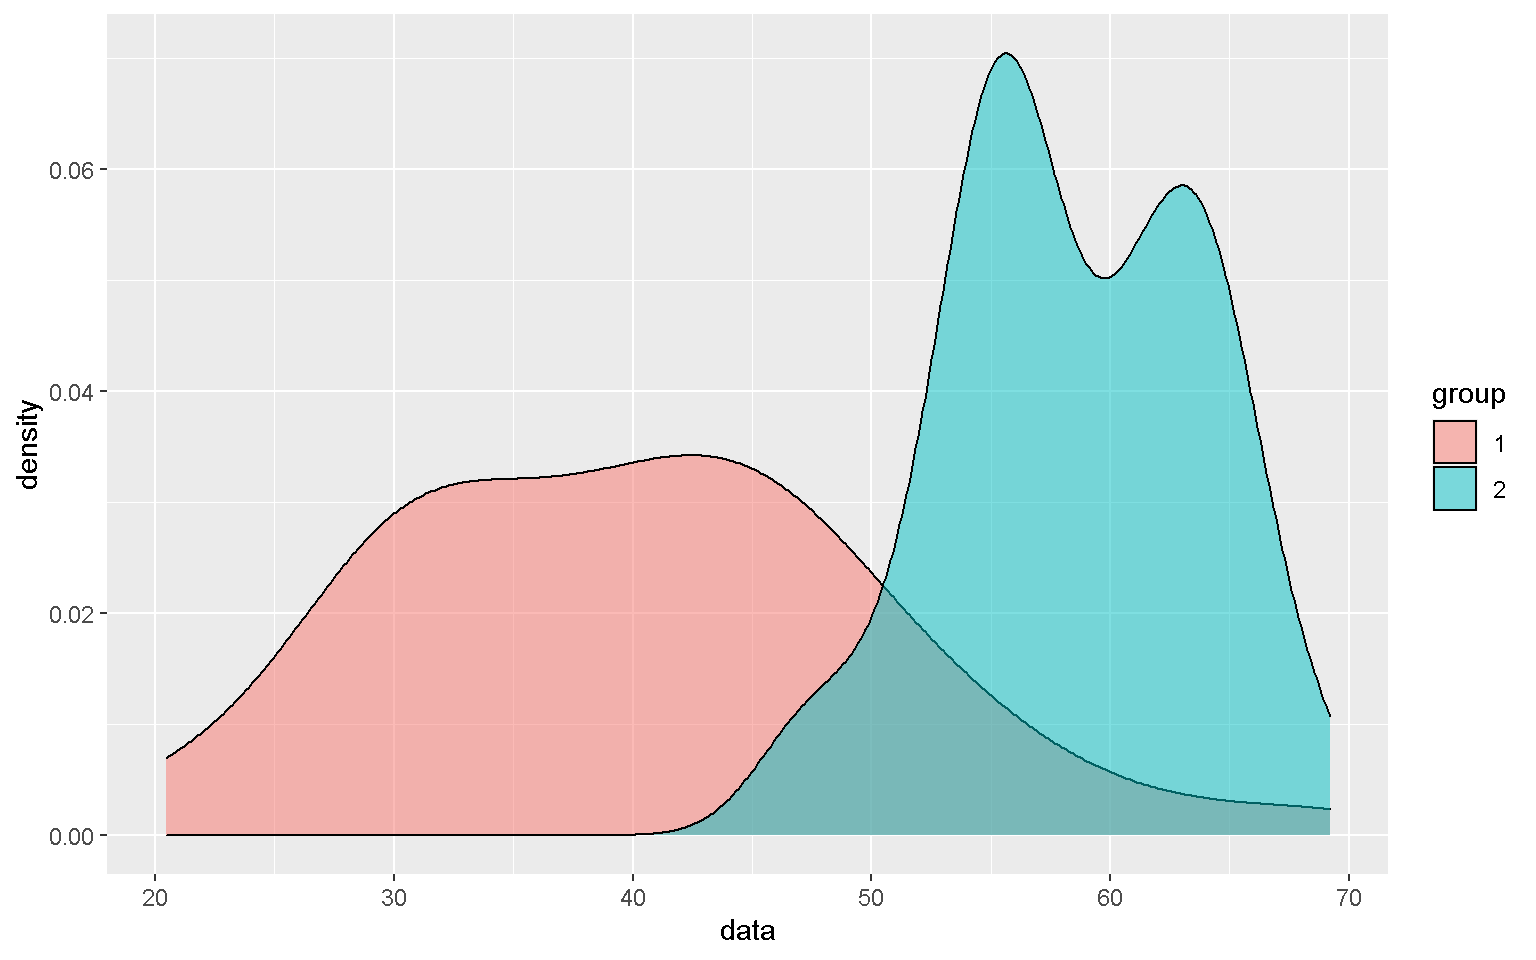
Smoothed density estimates
mp + geom_density(alpha = 0.5)
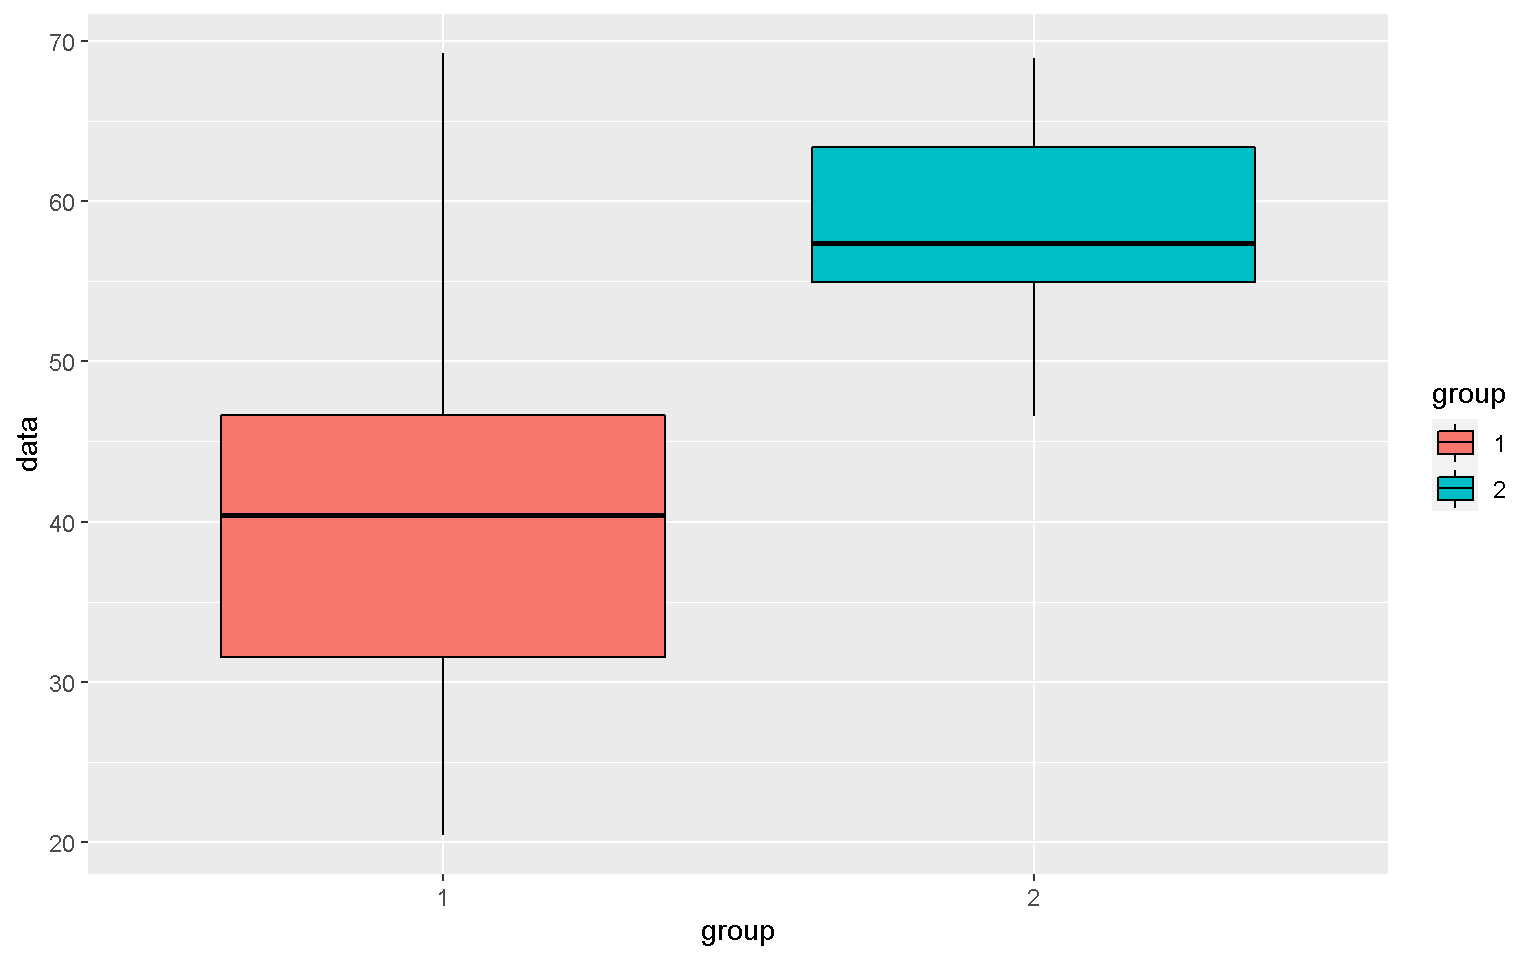
Boxplot
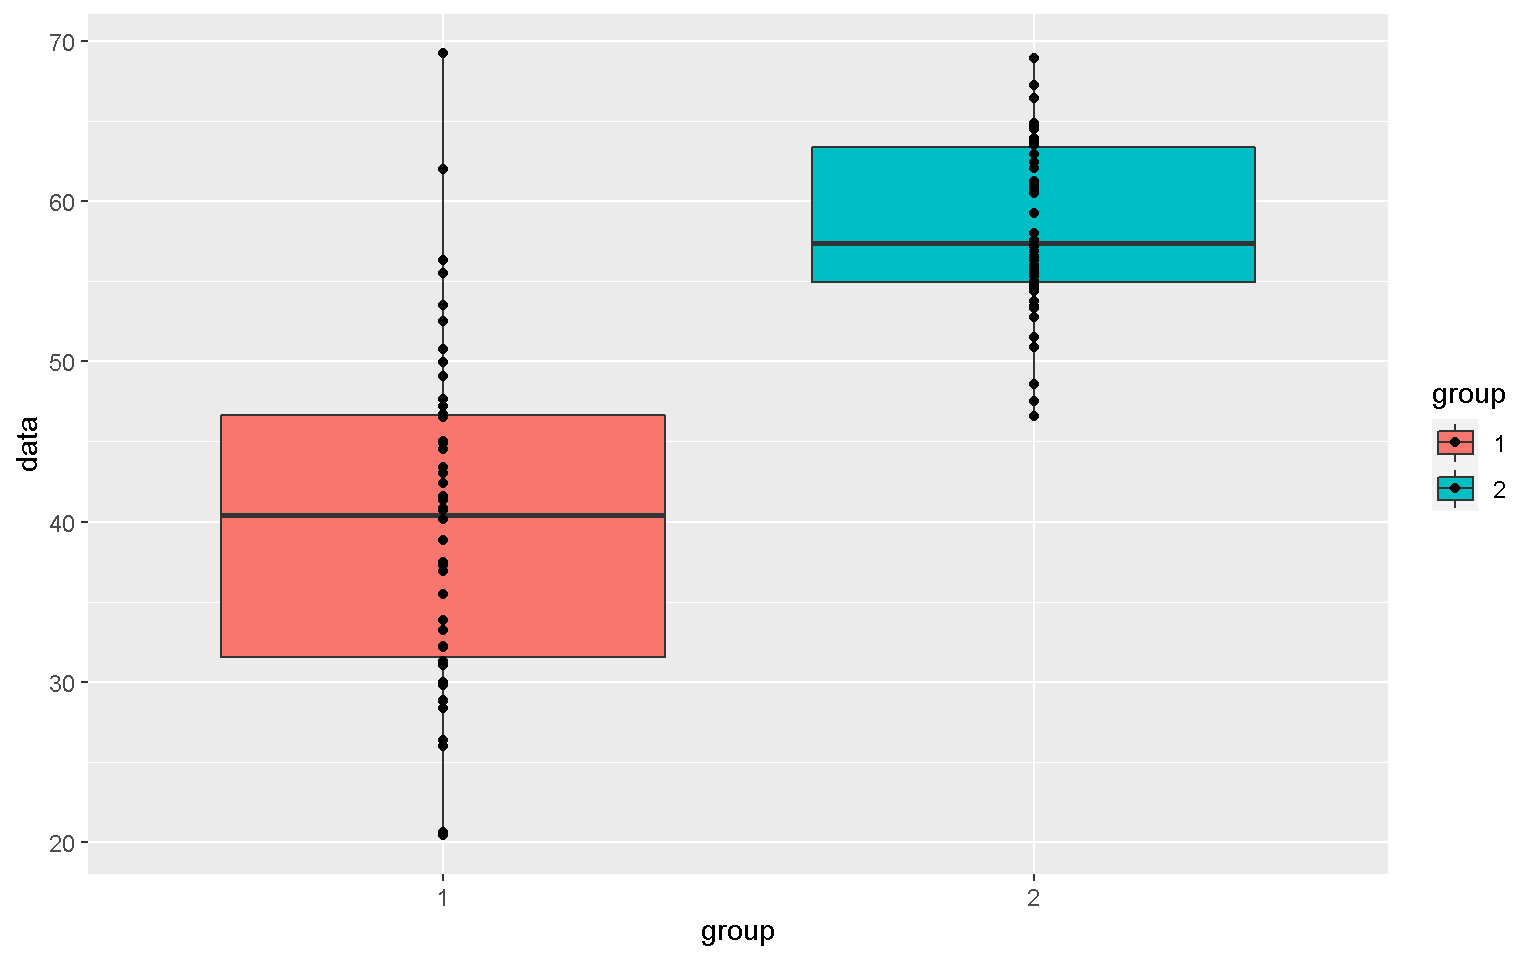
mp <- ggplot(xx, aes(x = group, y = data, fill = group))
mp + geom_boxplot(color = "black")
mp + geom_boxplot() + geom_point()
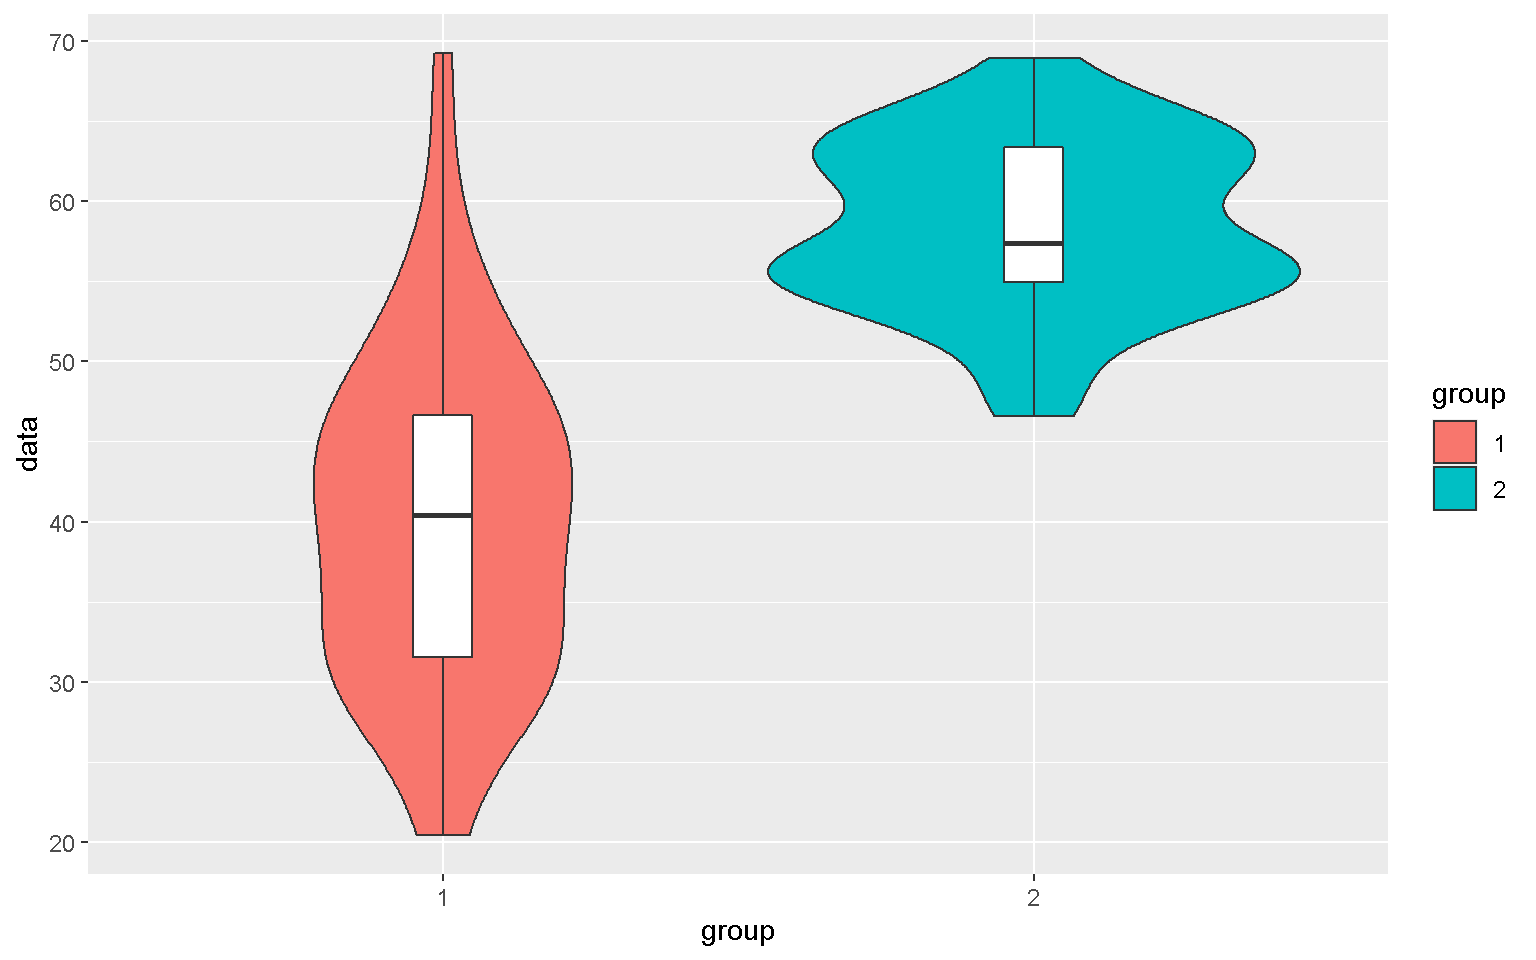
Violin Plot
mp + geom_violin() + geom_boxplot(width = 0.1, fill = "white")
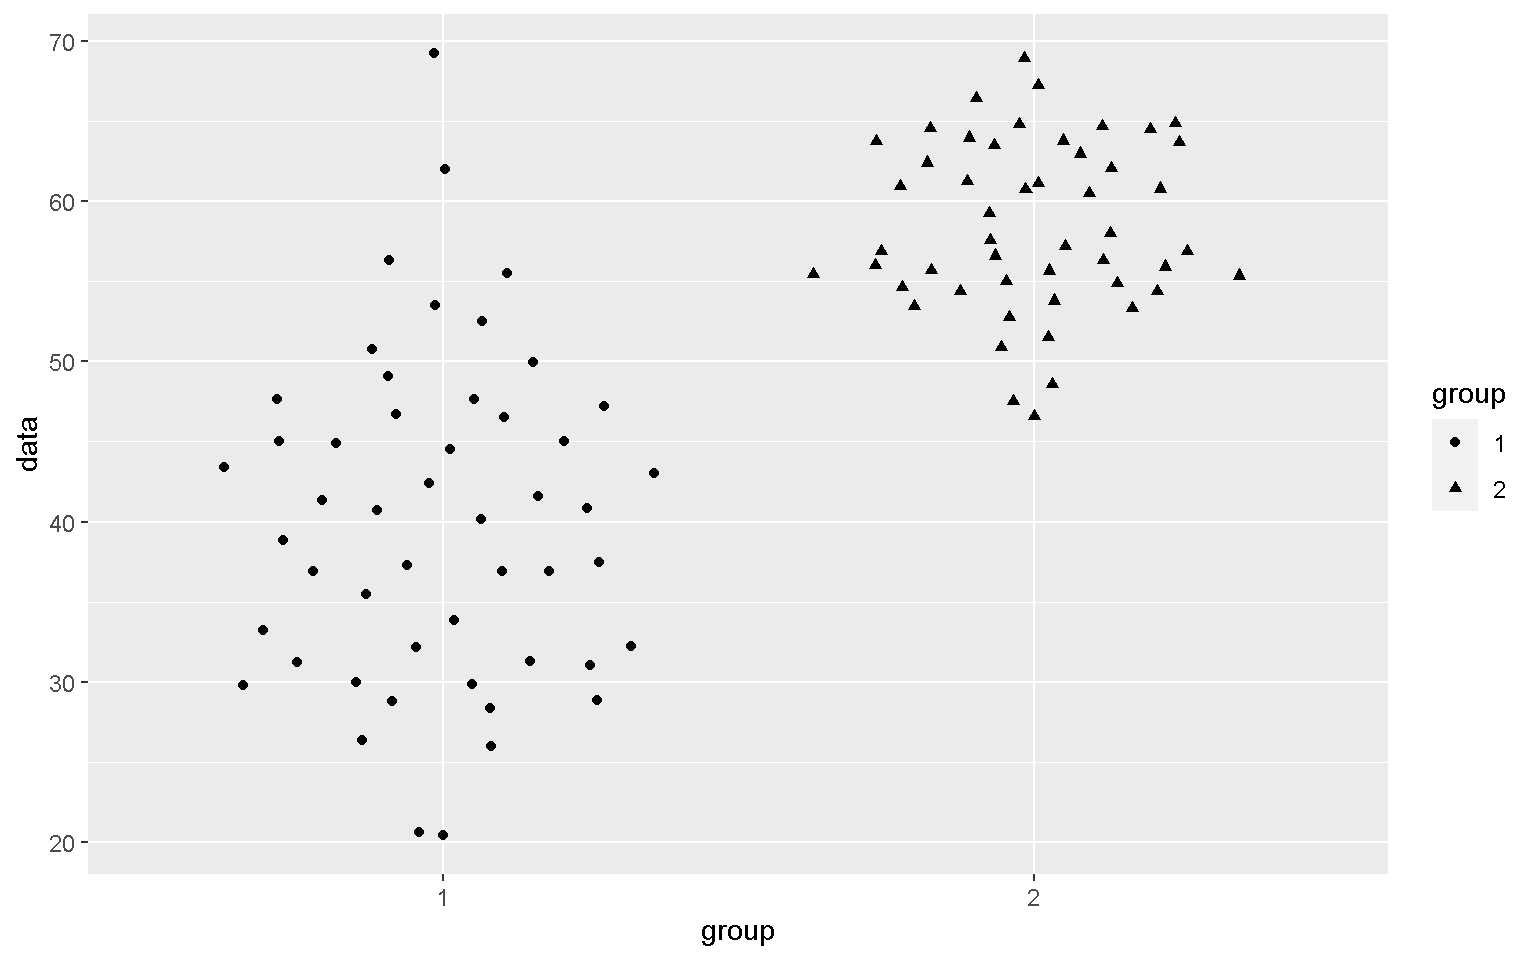
library(ggbeeswarm)
mp + geom_quasirandom()
Additional packages such as ggbeeswarm and ggrepel also contain useful functions to add to the functionality of ggplot2

mp + geom_quasirandom(aes(shape = group))
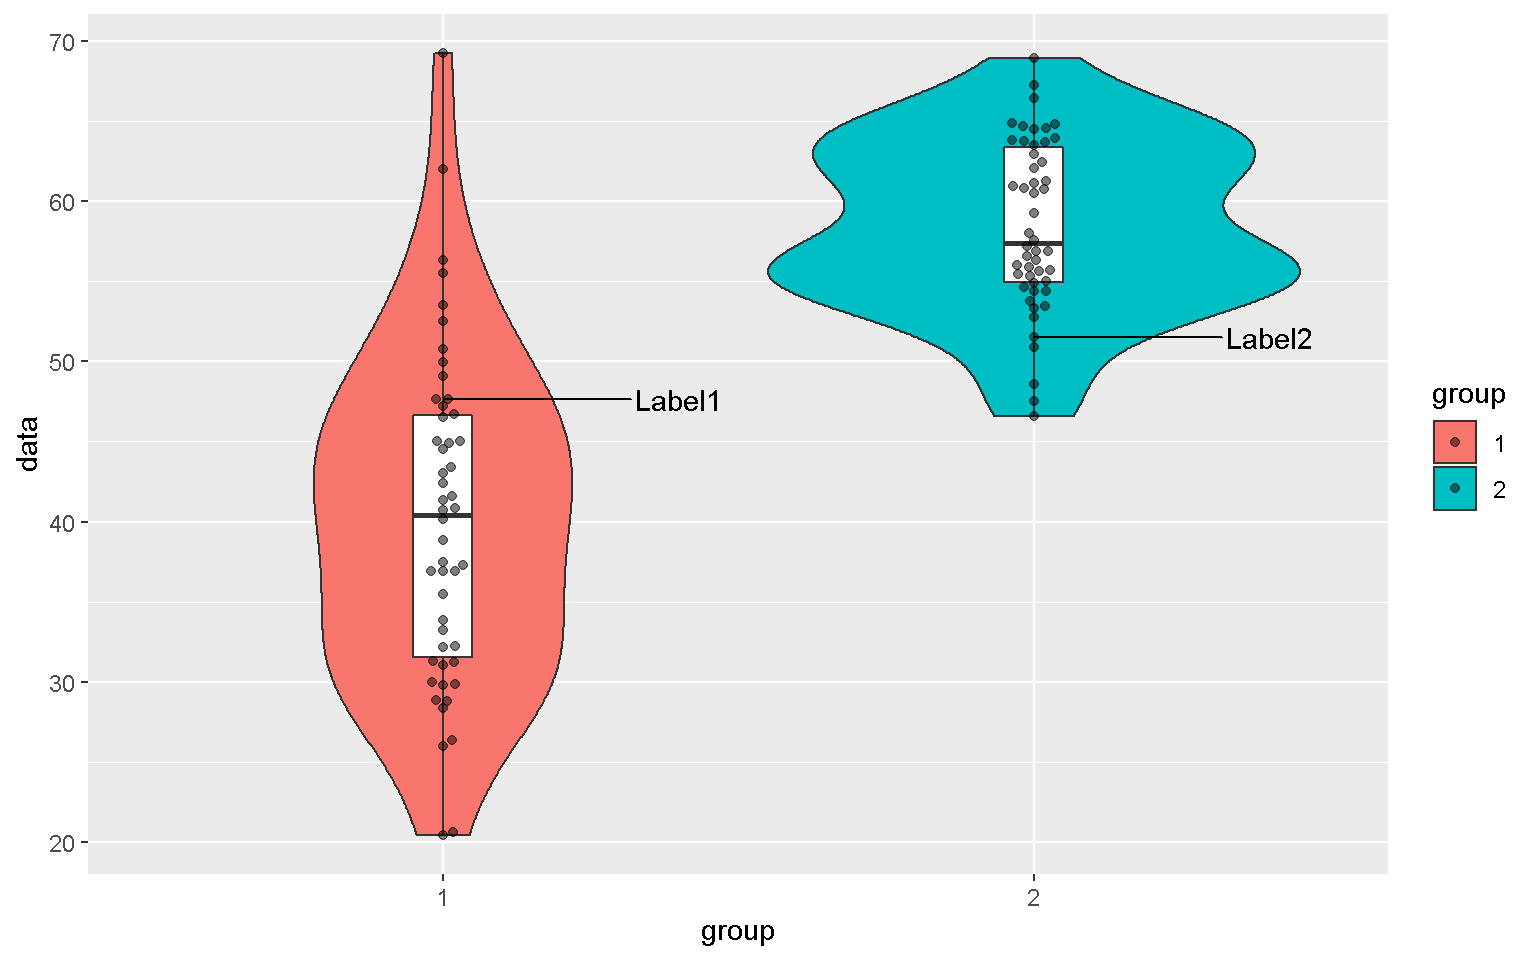
mp2 <- mp + geom_violin() +
  geom_boxplot(width = 0.1, fill = "white") +
  geom_beeswarm(alpha = 0.5)
library(ggrepel)
mp2 + geom_text_repel(aes(label = label), nudge_x = 0.4)
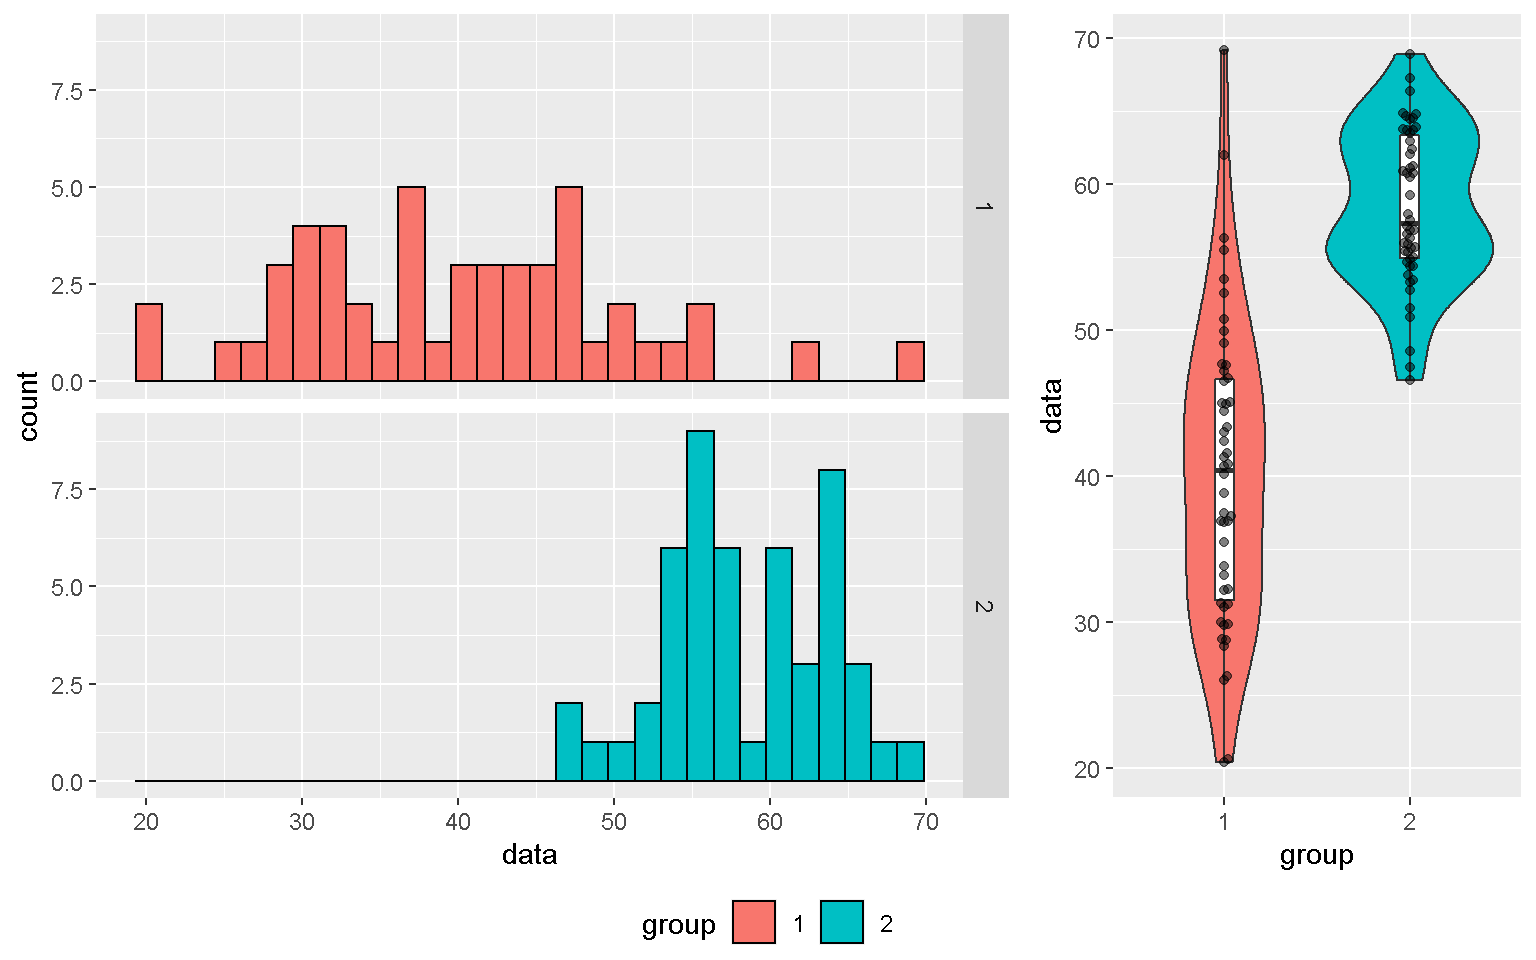
library(ggpubr)
ggarrange(mp1, mp2, ncol = 2, widths = c(2,1),
          common.legend = T, legend = "bottom")
Key Points
Remember to load your ggplot2 library before writing your code
Find the best graph meets your need