How to upload and visualize your data with Helium
Overview
Teaching: 15 min
Exercises: 15 minQuestions
How to load pedigree and categorical data files into Helium?
How to visualize my pedigree details in each panel?
Objectives
Walk users through each panel of the Helium visualization interface.
Load your data into Helium
-
Open the Helium from your local computer.
-
First, we want to upload the pedigree data in your local computer into Helium from the Overview Panel for visualization.
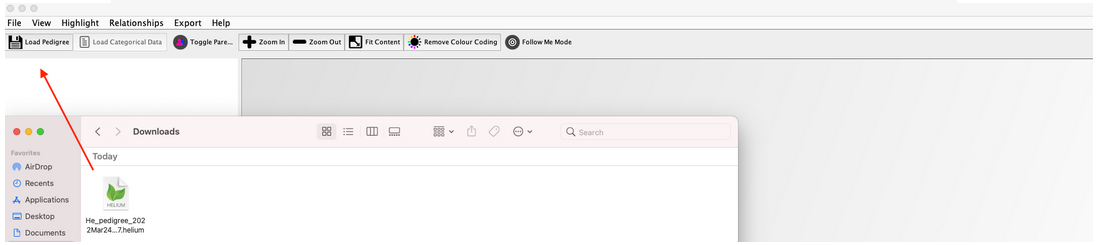
-
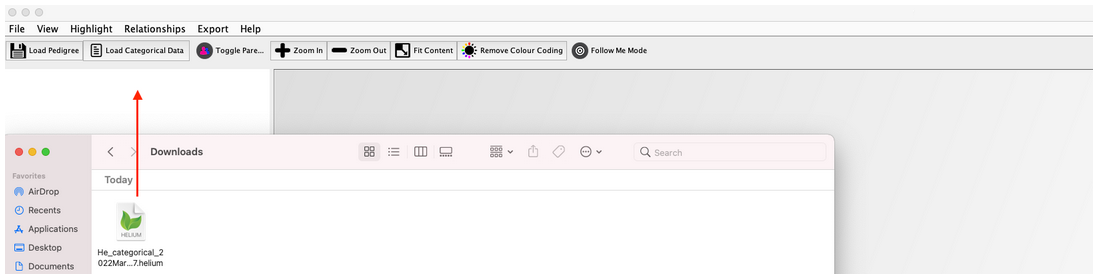
Then, let us repeat the same step with categorical file. Categorical file allows you to view traits in both Data Selection Overview Panel and Detail Panel.
Visualize your data with Helium Pedigree Visualization Framework
As shown in the below screenshot, your window is split into four main panels.
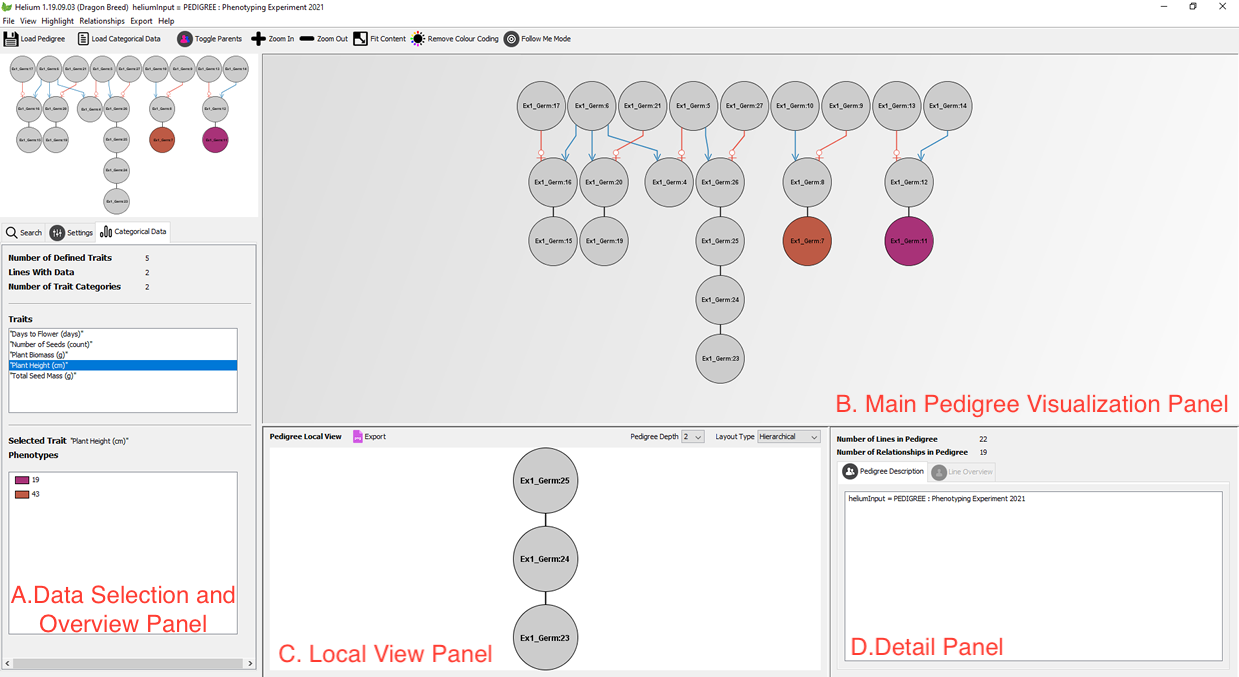
A. Data Selection and Overview Panel
Panel A provides a high level overview of the entire pedigree, which acts as a reference point for the large pedigrees. Zoom in or zoom out on the top part of Panel A to select the relationship of interest. Use Search feature to look up specific germplasm. You can also use the Settings tab to customize your visualization
B. Main Pedigree Visualization Panel
Zoom across the window to see the detailed relationships between germplasms in Panel B.
C. Local View Panel
Panel C permits local view of a line of interest. You can use pedigree depth function to select the pedigree depth (custom-defined how many generations you hope to go back). Export function in this panel allows you to get a high-quality .png file for future visualization or publication.
D. Detail Panel
Click on Line Overview to view trait details and overview statistics of each selected germplasm from panel C.
Key Points
You need to always load in the pedigree file first, then the categorical file to overlay the information.